Seattle Condo Market Update September 2022
While the warm, sunny summer weather seems to be sticking around longer than usual, Seattle’s condo market decided to get a jump start on the northwest fall housing season. Inventory climbed as condo sales and selling prices dipped in September.
Selling Prices Soften
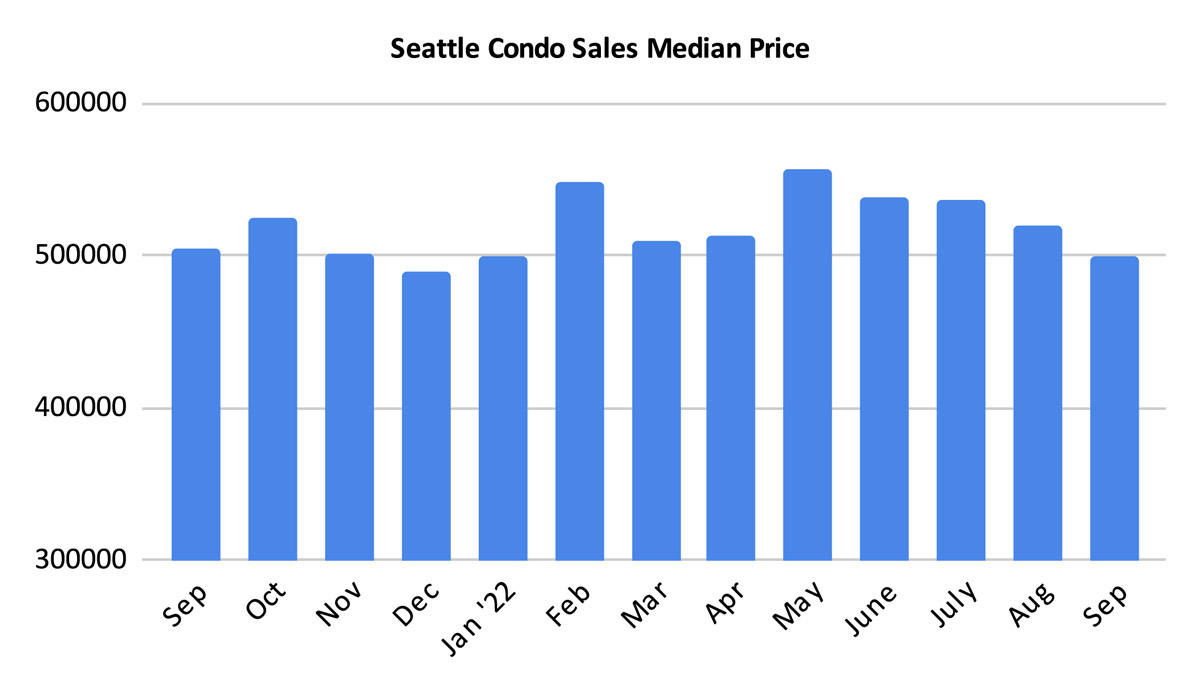
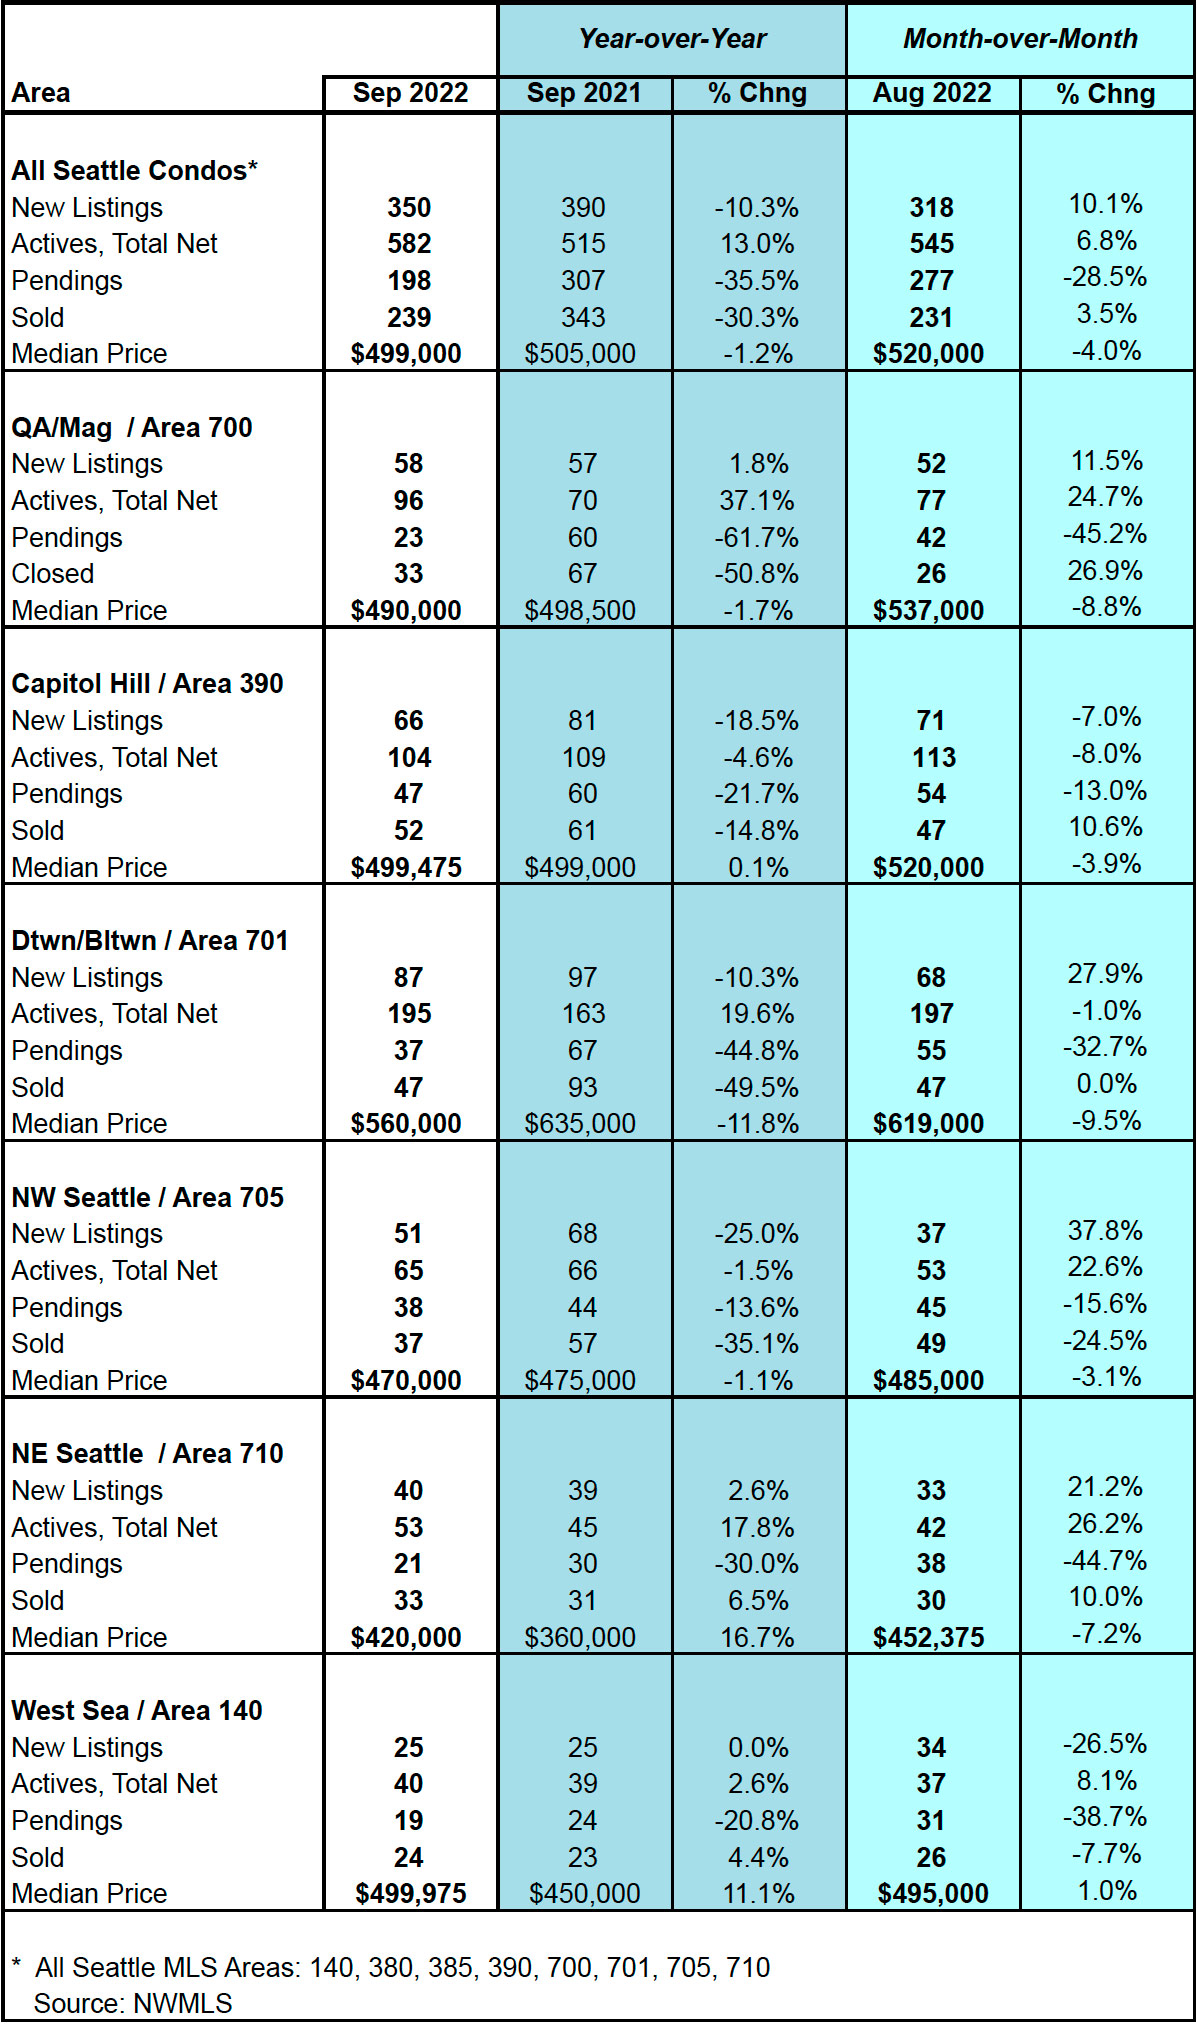
After 12 consecutive months of year-over-year (YOY) increases in the median sales price, the citywide Seattle condo median declined 1.2% to $499,000 compared to last September. It also reflected a 4% dip from the prior month and was first time since January that it fell below $500,000.
However, that’s not the complete picture. The citywide median was significantly impacted by results in the condo dense downtown/Belltown neighborhood, which decreased 11.7% YOY. Queen Anne (-1.7%) and Northwest Seattle (-1.1%) also exhibited mild YOY declines.
On the other hand, Northeast Seattle and West Seattle saw double-digit YOY increases in their median sales prices by 16.7% and 11.1%, respectively. See table at the bottom of the post for more neighborhood details.
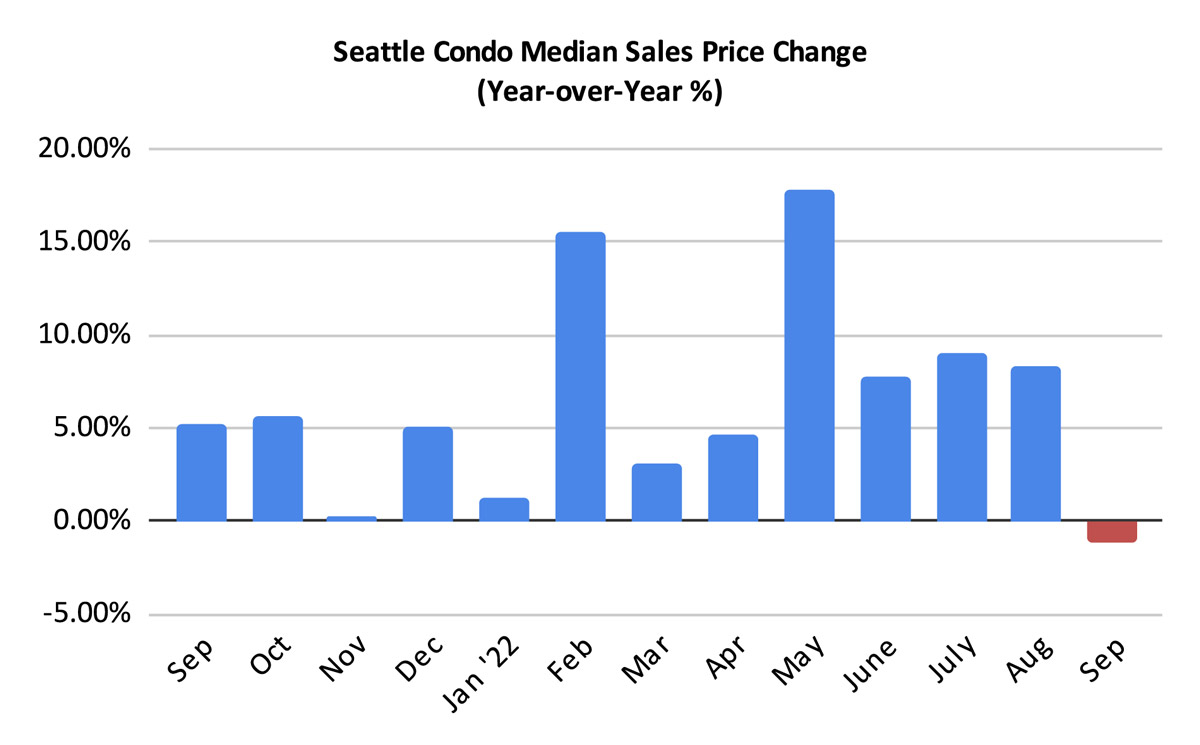
As the graph below shows, the median sales price has been trending downward after the brief summer plateau. This highlights Seattle’s cyclical, seasonal housing market. Median sale prices historically trend downward during the autumn/fall months from the change in weather and the holiday season.
However, our market has been affected by the overall softening and shifting of the housing market. That, and rising interest rates, likely accelerated the seasonal slowdown this year.
Inventory Rises, New Listings Slows
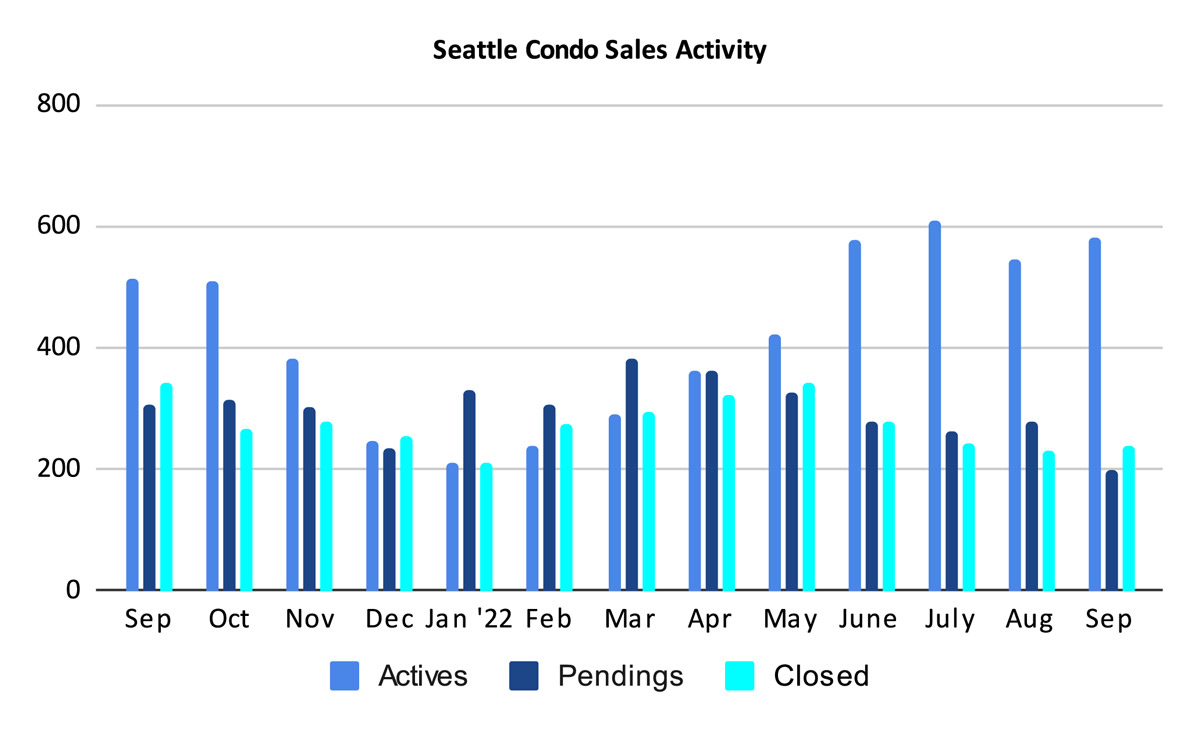
Seattle condo listings continued to rise last month, ending the month with 582 active Seattle condo units for sale in the NWMLS. That’s an increase of 13% over last September and 6.8% over last month.
As has been the case for the past several months, however, new listings are coming to market at a declining rate. There were 350 new listings in September, which was 10.3% fewer compared to a year ago. Though, we had 10.1% more new listings than came to market in August. Listings taper off during November and December, so we’ll see it decline.
The NWMLS active listings figure is based on the number of active listing on the last day of the month. The primary factor contributing to the number of active listings was the significant drop in sales in September. Had we maintained a similar level of sales that we had in August, then September’s listings would have declined rather than increased. Essentially, fewer units sold resulting in higher inventory levels for the month.
Like the median sales price, inventory levels also differ by neighborhood. For example, the number of active listings increased considerably in Queen Anne (+37.1%), downtown/Belltown (+19.6%) and Northeast Seattle (+17.8%), compared to last September.
Conversely, the number of active units for sale decreased in Capitol Hill/Central (-4.6%) and Northwest Seattle (-1.5%).
Lastly, the NWMLS database does not include hundreds of finished but unlisted new condo units in the downtown area.
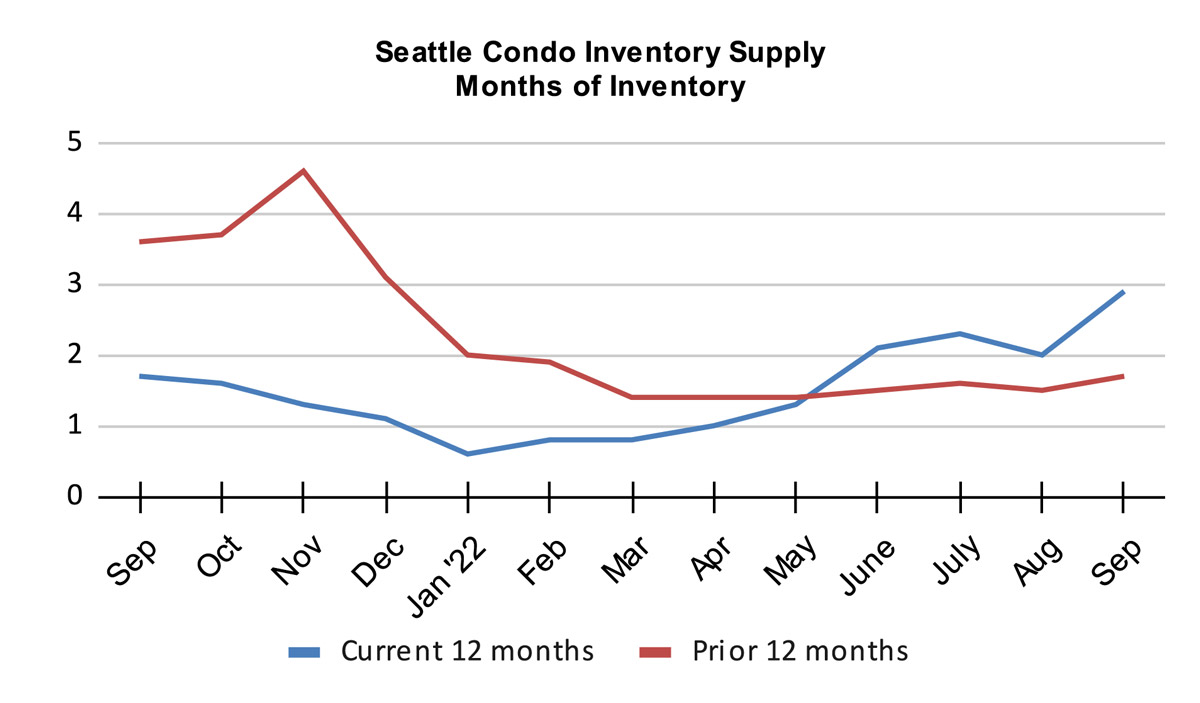
The inventory supply rate for September increased to 2.9-months of supply, which moves us closer towards a normal, balanced market condition.
We base the inventory supply rate on pending sales transactions (number of actives divided by pendings). Thus, the drop in pending transactions last month helped drive the supply rate up.
A supply rate of under 4 months is considered a seller’s market, between 4 to 6 months would be a normal or balanced market, and over 6 months would be a buyer’s market.
For a historical perspective, Seattle’s condo market has been in a seller’s market environment since Spring 2012, with the exception of November 2020 when we briefly entered a normal market. However, that quickly transitioned back to a tighter seller’s market.
The other inventory metric used to characterize the market, the absorption rate, was 34% in September.
Condo Sales Take A Tumble
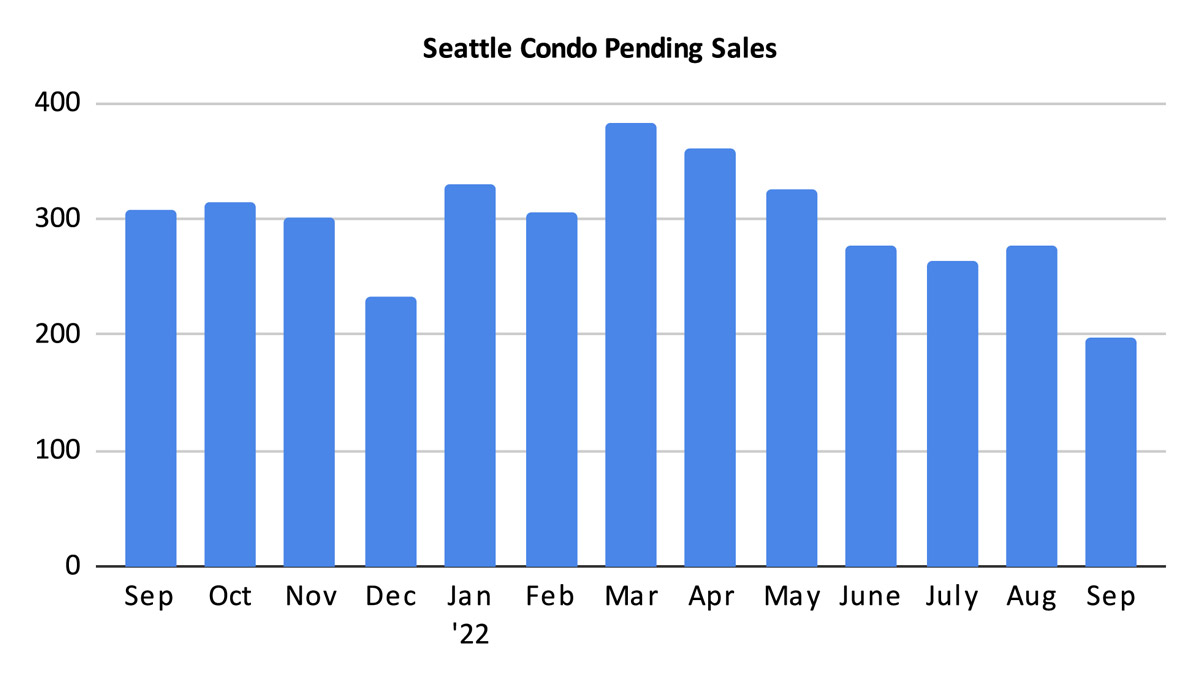
As mentioned, condo sales tumbled in September, declining 35.5% YOY and 28.5% MOM, to 198 units. That was felt throughout the city as every NWMLS neighborhood area reflected reduced sales activity for the month.
By area, sales activity nose-dived in Queen Anne, declining a whopping 61.7% compared to last September, and down 45.2% from the previous month. Downtown/Belltown wasn’t far behind decreasing 44.8% YOY and 32.7% MOM, respectively.
This is somewhat an interesting result since we usually experience an end of summer bump in sales activity in September/October. We did not experience that this year.
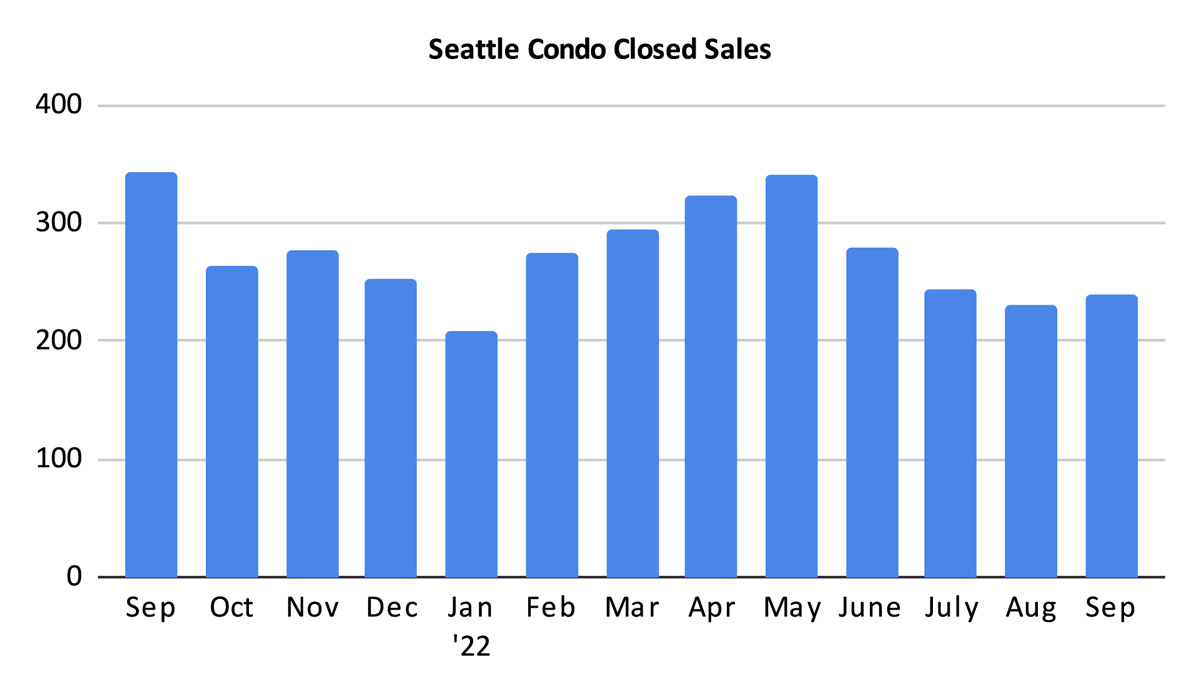
The number of closed Seattle condo sales improved over August by 3.5% to 239 units. But, we had anticipated that due to the higher number of pending sales back in August (closings lag behind pendings by a month). However, compared to the same period last year, closings were down 30.3%.
We can an expect a sharp decline in October closings given September’s reduced pending sales activity.
Recap and Outlook
The buoyant nature of Seattle’s condo market was apparent in September. While we usually experience a slight bump in activity between the end of summer and the coming of fall, we did not have that this year.
Sales activity slumped, median selling prices reversed course and inventory rose. That’s the story when looking at Seattle holistically. However, Seattle is comprised of neighborhood micro-markets and their results and buyer/seller experiences can vary greatly between them.
Seattle’s housing market is also cyclical and influenced by the seasons. As we enter the fall season with the changing weather and the busy holiday season, condo sales and prices historically soften. The overall housing market shift, rising interest rates and lower buyer confidence puts additional constraints on our local market.
As we close out the year we should see fewer sales and lower inventory levels and median sale prices.
For buyers, the fourth quarter provides opportunities with less competition and potentially better purchasing terms and prices.
For sellers, the fall season can be a challenge with a longer market time and depressed prices. Unless they need to sell, many sellers will hold out and list in the spring.
Seattle Condo Market Statistics September 2022
Source: Northwest Multiple Listing Service. Some figures were independently compiled by Seattle Condos And Lofts and were not published by the NWMLS.
© SeattleCondosAndLofts.com


