Seattle Condo February 2024 Market Review
Brushing off the winter doldrums, the Seattle condominium market came alive in February. Condo inventory, unit sales activity and selling prices improved last month.
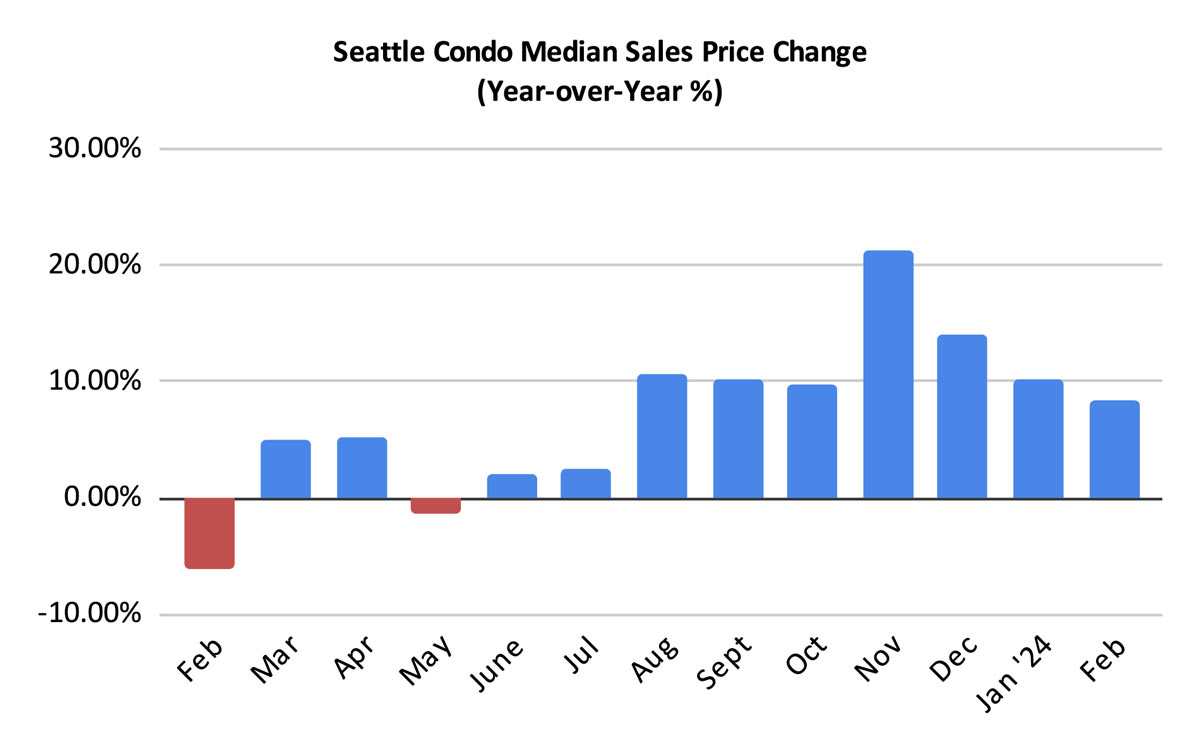
Condo Values Rising
The Seattle citywide condo median sales price rose 8.4% year-over-year (YOY) and 3.8% over the prior month to $558,000. All areas of the city exhibited YOY increases in February. And, several had double-digit jumps – Capitol Hill / Central (+19.9%), Northeast Seattle (+19.1%), Northwest Seattle (+19.0%), downtown / Belltown (+16.2%) and SoDo / Beacon Hill areas (+16.2%). Click here to view full neighborhood area statistics.
The Northwest Multiple Listing Service’s condo classification include properties legally organized as a condominium in Washington State. Prior to 2023 this principally included what we’d normally think of condos – multiple unit buildings and complexes – where a condo unit was typically just a flat-styled unit.
With the proliferation of townhomes being built and classified as condos in 2023 along with Accessory Dwelling Units (ADUs) and Detached Accessory Dwelling Units (DADUs), the definition of condos expanded. As a result, these higher valued properties, which comprised 21% of closed condo sales in February, that are essentially single residence homes, shifted the median point upwards.
If we exclude these properties then Seattle’s median sales price for traditional condos would have been $508,500 in February instead of $558,000. And, if we compare traditional condo sales between February 2023 and 2024, the median sales price increased 4.3% YOY rather than 8.4%. That’s still a healthy rise in value.

Inventory Increased, Yet The Market Tightened
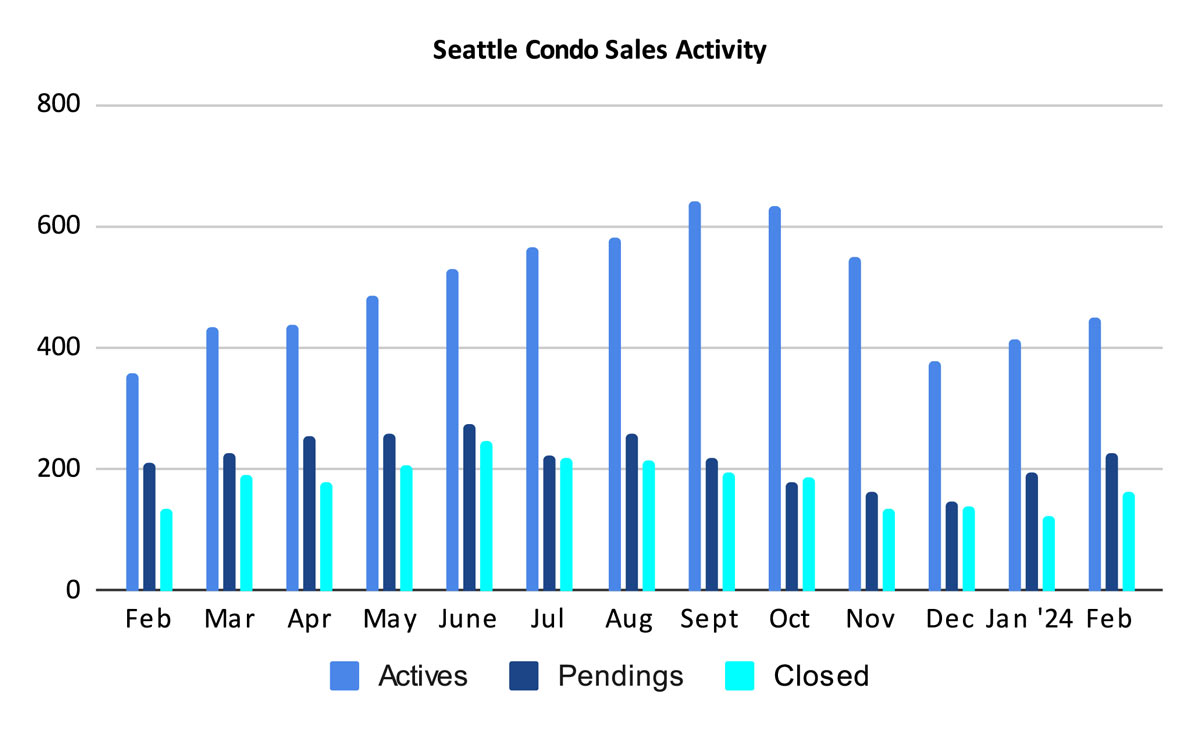
Seattle’s condo inventory has started to rise rather briskly. We ended February with 451 units compared to 360 for the same period last year, an increase of 25.3%.
Specifically, sellers listed 324 new listings during February, which was 33.9% more than they did last February.
We started February with 414 active listings and sellers added 324 new listings for a total of 738. Of that number, 225 went under contract (Pending) and 62 came off the market for other reasons, leaving 451 at month’s end.
These figures only include those properties listed in the NWMLS. There are numerous properties – new construction condo buildings and townhomes – that are available but not yet listed for sale in the NWMLS. Therefore, actual inventory levels are a bit higher.
Interestingly, even with the jump in listings, the condo inventory supply rate actually decreased ever so lightly to 2.0-months of inventory, due to stronger sales activity. There are two ways to calculate the inventory supply, either using pending transactions or closed sales. We use pendings for our calculations as that reflects more current buyer activity.
The inventory supply rate is a metric utilized to characterize the housing market environment. A rate of less than 4-months of supply is considered a seller’s market. A rate between 4 to 7-months is a normal or balanced market. While a rate greater than 7-months of supply would be a buyer’s market.
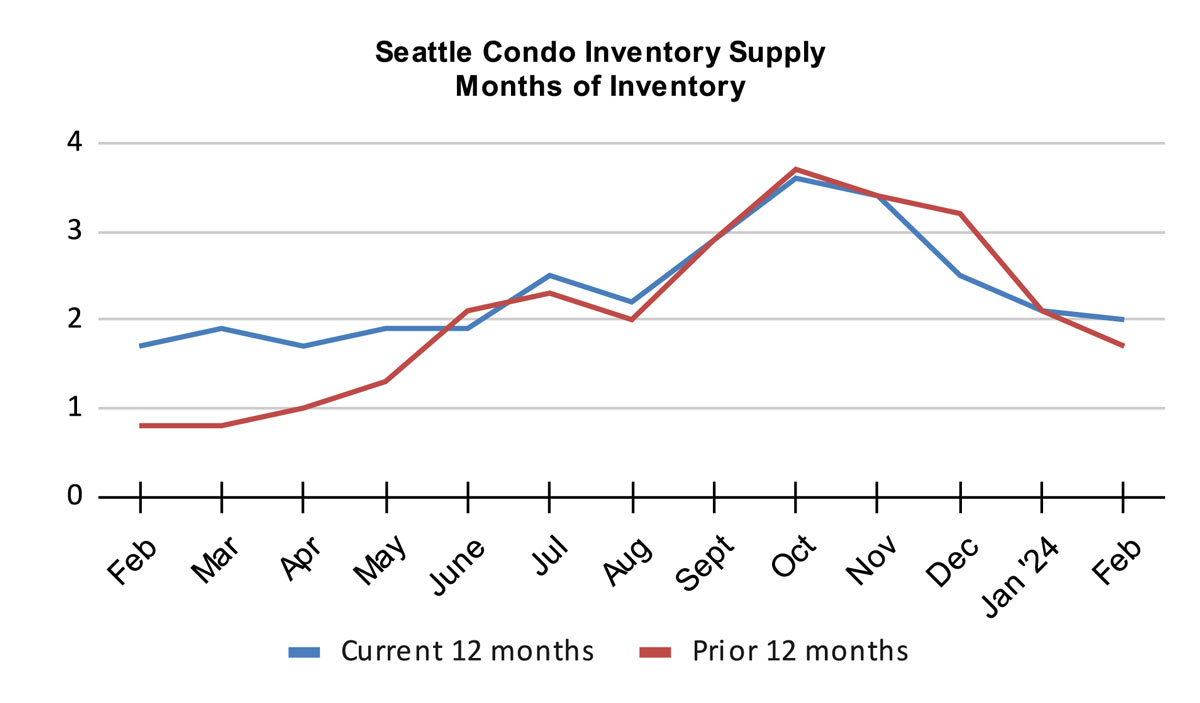
With a citywide inventory supply rate of 2-months, Seattle would be classified as a fairly strong seller’s market. In fact, we’ve been in a seller’s market since 2012, a 12-year long stretch.
However, Seattle’s housing market is made of micro markets of local neighborhoods and price points. Buyers and sellers will experience varying market conditions depending on their price point and locale.
Typically, the lower price ranges are the most competitive and buyers may encounter bidding wars. On the other hand, premium priced condos may lag on the market offering buyers more breathing room.
Condos located closer in to the city core and to neighborhood urban village centers, or transportation hubs, may be more appealing to buyers. Though, density can have an impact since the overwhelming number of condos surround the city core, and therefore have greater supply.
The absorption rate is another metric to classify the housing market. The Seattle condo absorption rate for February was 49.9%.
Buyers are Buying
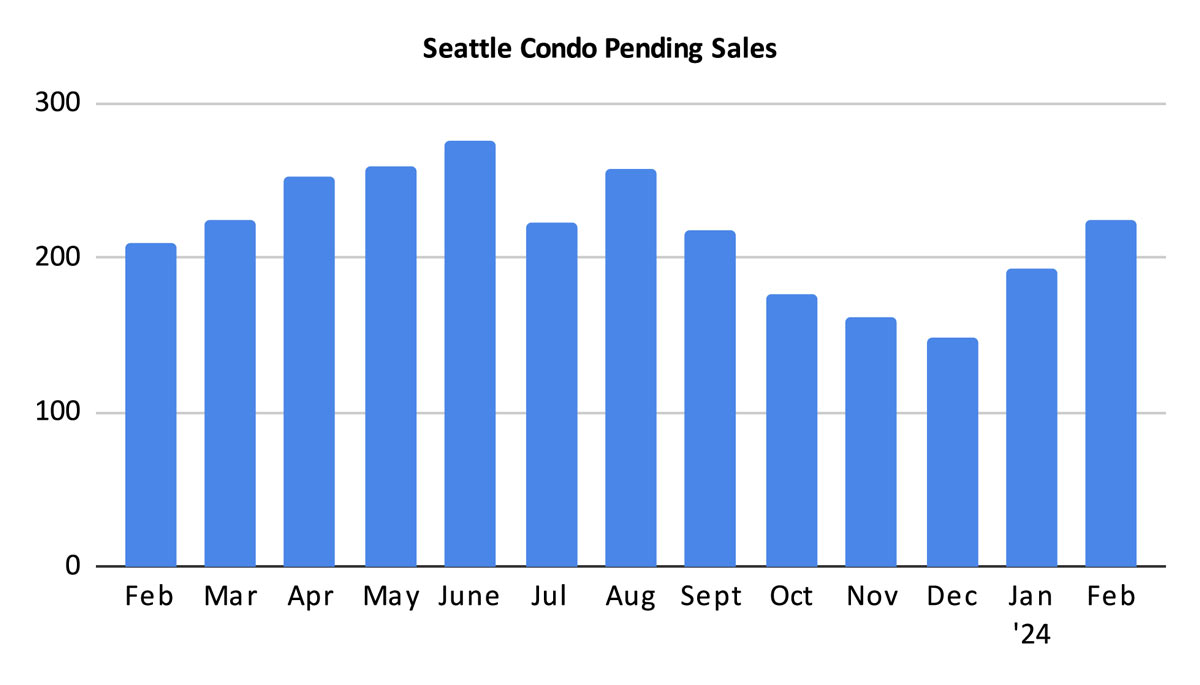
The number of pending condo sales transactions (listings under contract) rose to 225 properties, reflecting a one-year and one-month increase of 7.7% and 16.6%, respectively.
The first half of the year, particularly the spring, is the peak period for real estate sales in the Pacific Northwest. As we progress towards summer, we should see condo sales pick up steadily.
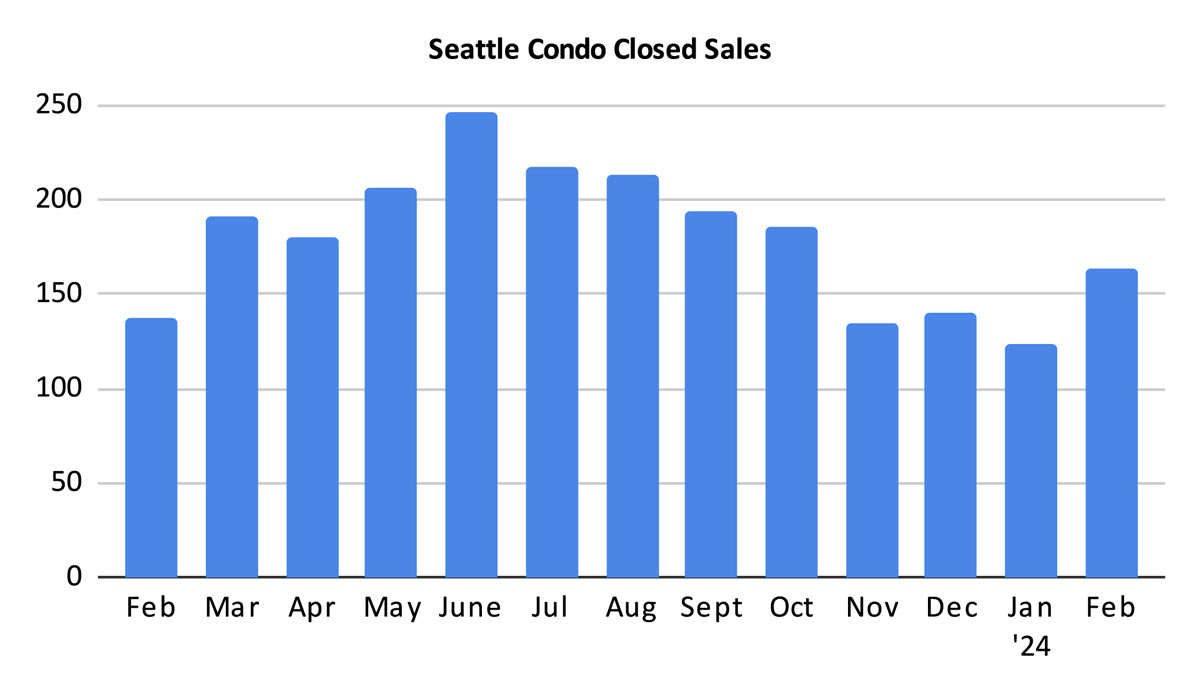
There were 163 closed condo sales in February, exhibiting a 19% increase over last February and 31.5% more than in the prior month. Closings lag behind pending sales activity, and with the greater number of pending transactions in February, the number of closings should rise in March.
In Summary
The Seattle condo market found its footing in February. Condo sales took off with solid gains in values even as listings increased. As we move towards our peak spring period, the Seattle condo market will continue to see improvements in sales activity, selling prices and more inventory.
Sales at the newer luxury condo towers and the proliferation of higher-end townhomes and ADU / DADU properties will undoubtedly help sustain higher median selling prices. On the other hand, with more inventory expected in the coming months, we could also see some balance.
Buyers will benefit from greater supply and more options. Though, depending on their desired neighborhood and price point they may find themselves in a competitive market place, especially for entry level properties. Or, for higher priced units in condo dense neighborhoods where sales are lagging, they may find a good deal.
Sellers generally will encounter a strong market overall. In fact, we’re now in our 12th year of being in a seller’s market. But, again, location and price points will affect their experience and outcome.
Thinking of buying or selling a condo this year? Drop us a line and let us get you started on your homeownership journey.
Seattle Condo Market Statistics February 2024

Source: Northwest Multiple Listing Service. Some figures were independently compiled by Seattle Condos And Lofts and were not published by the NWMLS.
© SeattleCondosAndLofts.com