May 2023 Seattle Condo Market Update
May 2023 proved to be a bit of a mixed bag for Seattle’s fluid condominium market. Looking at year-over-year (YOY) numbers, the market underperformed last year’s activity levels. While looking at trending month-over-month numbers, the market seemingly improved. Though, that is partly due to the seasonality of our market.
Selling Prices Improve
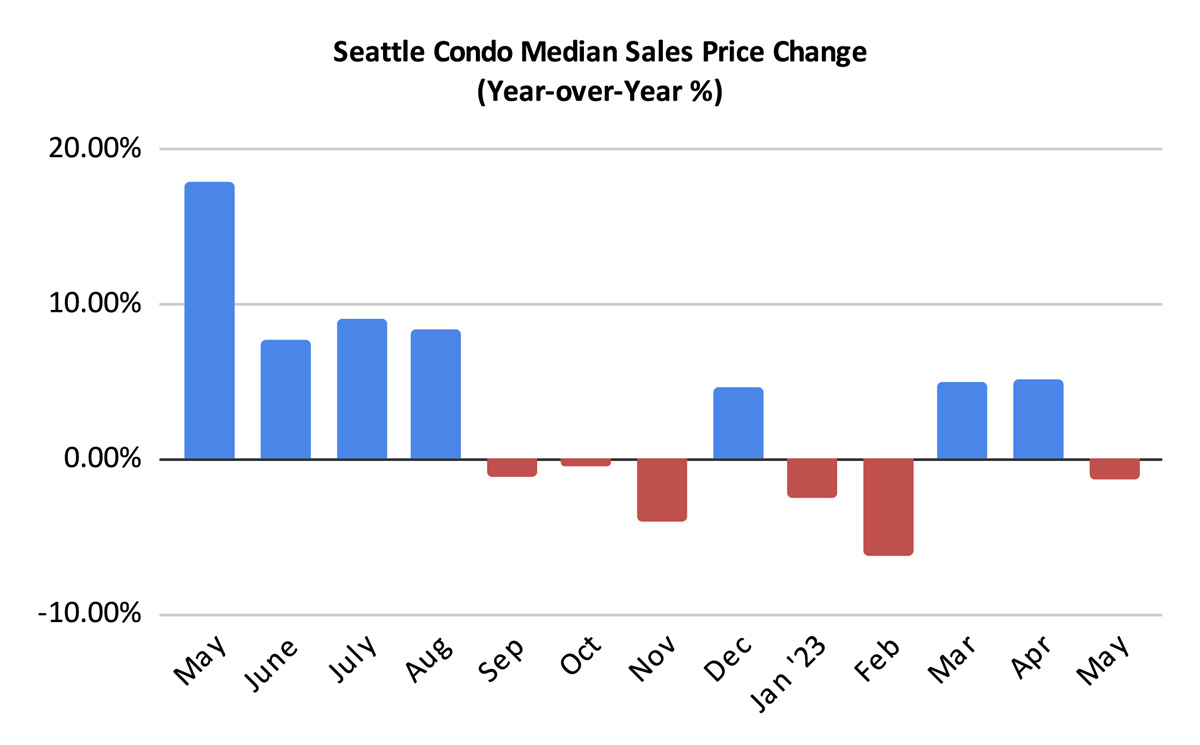
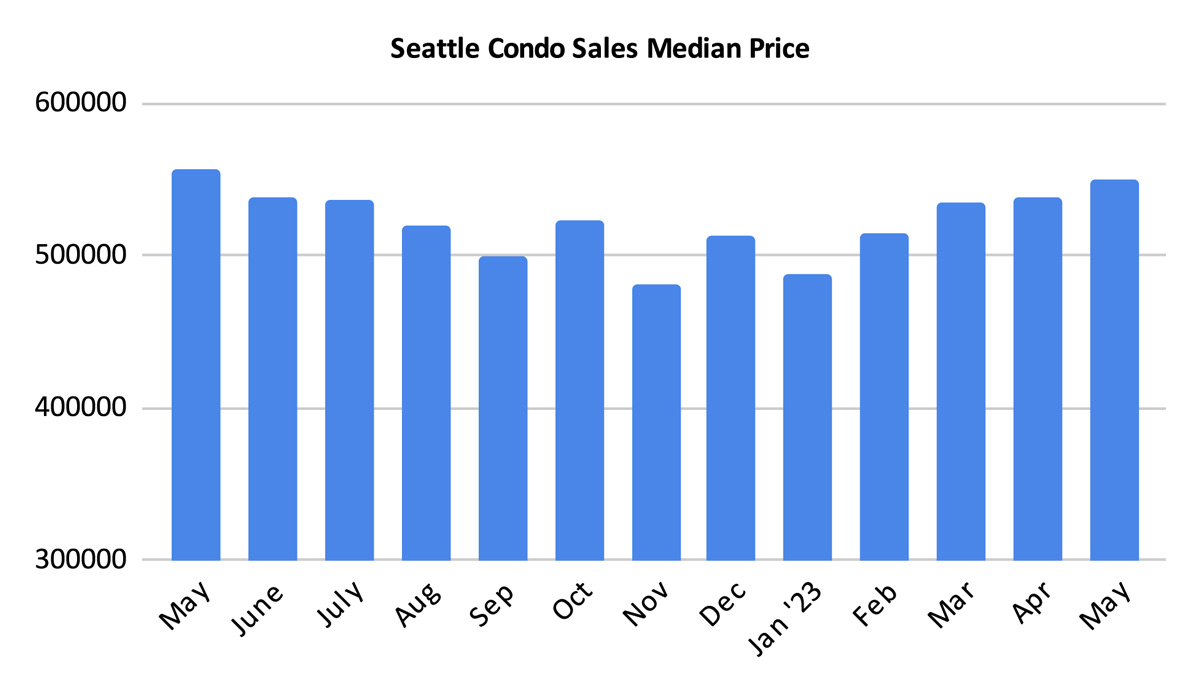
The graph below highlight the citywide Seattle condo median sales price decreased 1.3% year-over-year to $550,000. But, also reflected a 2% increase over April.
The reason I say it improved, is that the $550,000 median sales price in May 2023 was the 2nd highest on record. Second only to the $557,475 we had one-year ago in May 2022. And, over the past 12-month period we’ve experienced the highest sustained monthly median sales prices for any 12-month period.
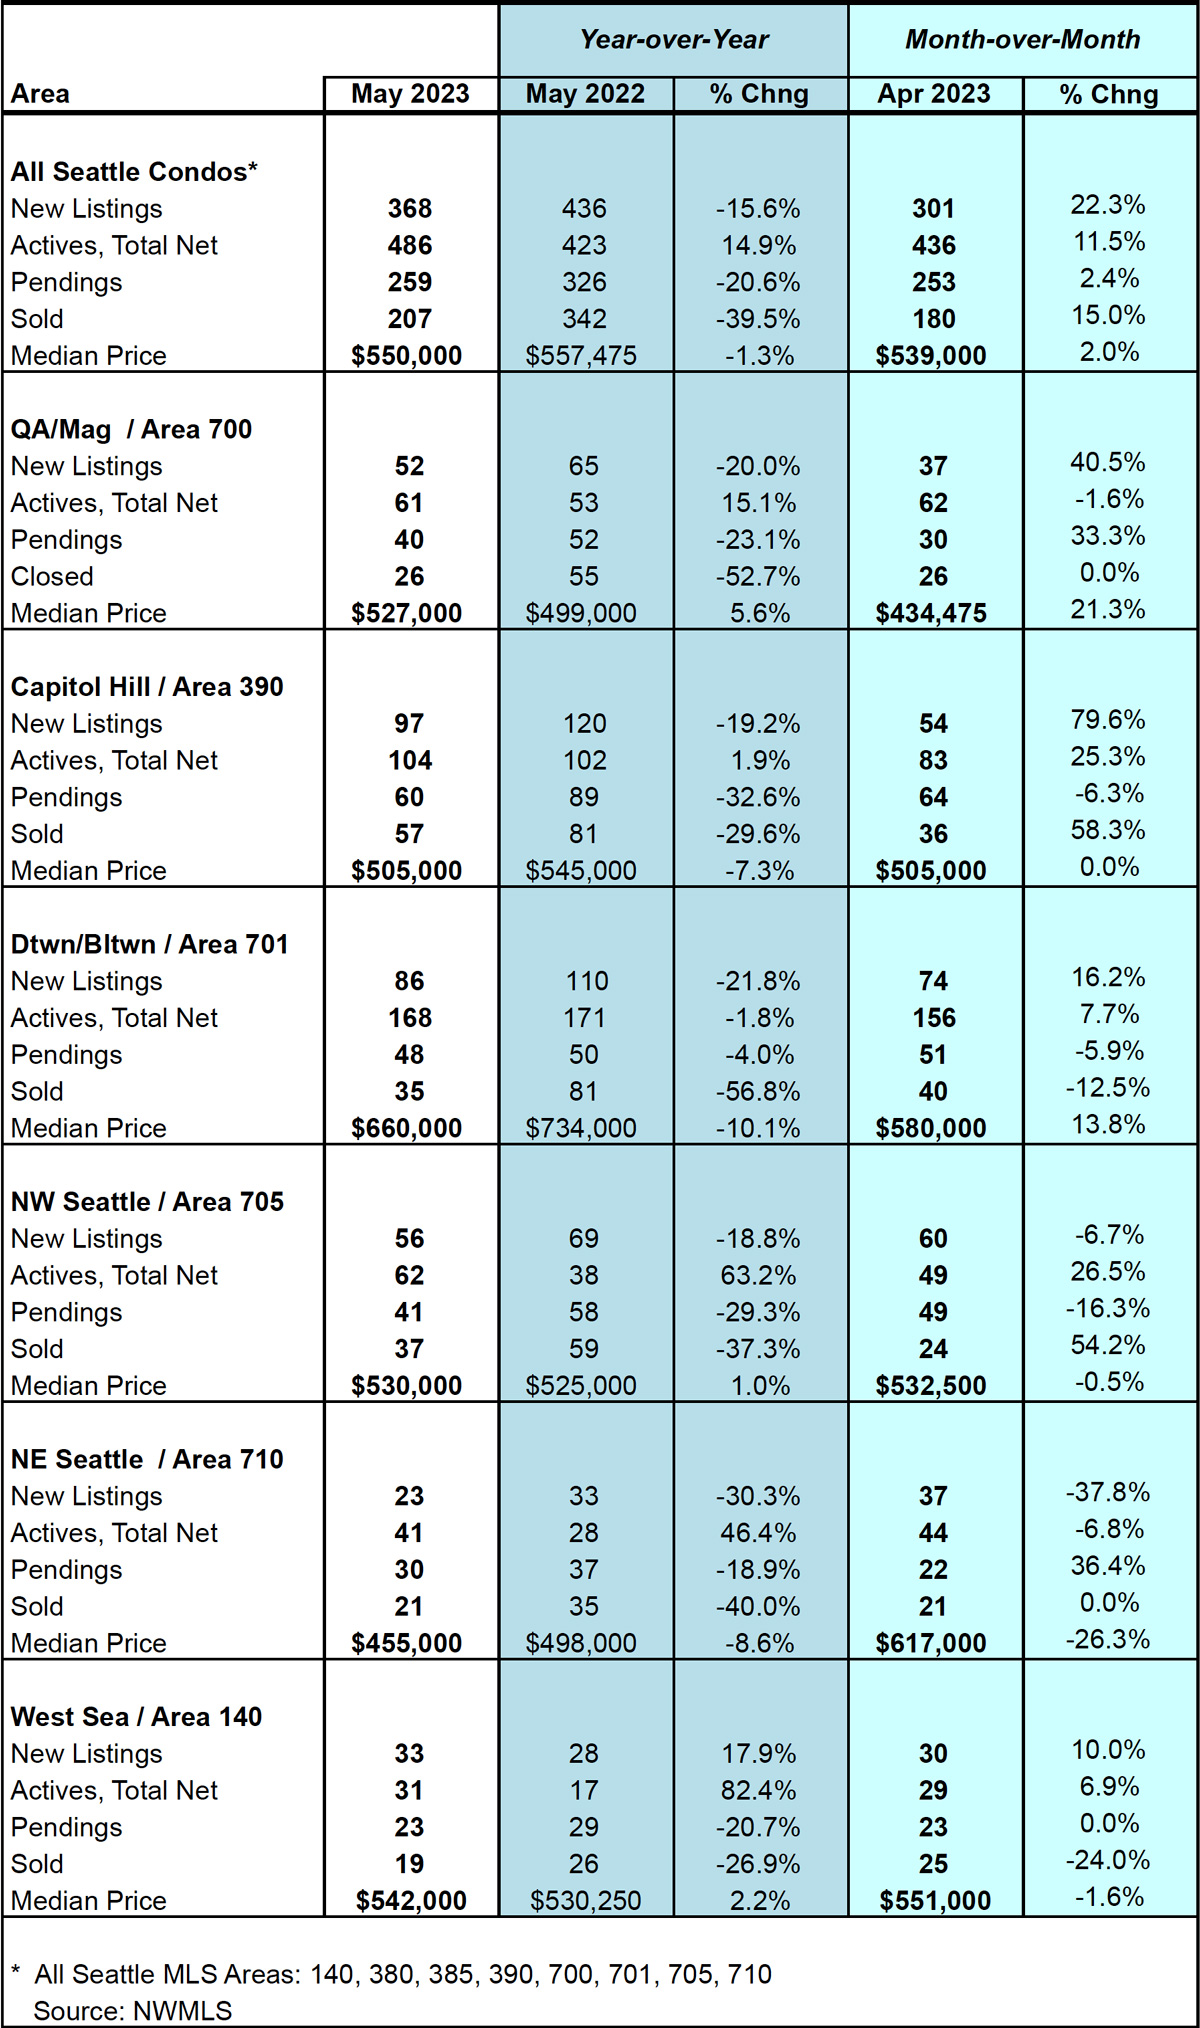
By NWMLS areas, YOY median sale prices rose in Queen Anne / Magnolia (+5.6%), Northwest Seattle (+1%) and West Seattle (+2.2%). Capitol Hill / Central (-7.3%), downtown (-10.1%) and Northeast Seattle (-8.6%) noted a decrease in their YOY monthly median. Complete neighborhood results are provided at the end of the post here.
Seattle Condo Inventory Rises
After a slow start to the spring season, Seattle’s resale condominium inventory is rising. May 2023 ended with 486 units listed for sale in the NWMLS. That’s 14.9% more listings YOY and 11.5% more than a month ago.
Yet, inventory levels increased at slower pace compared to last May. There were 15.6% fewer sellers putting their units up for sale than there were a year ago (368 new listings in May 2023 vs 436 in May 2022).
Thus, the increased inventory supply wasn’t due to more listings coming to market, but rather, due to fewer buyers buying.
We started the month with 436 listings and added 368 new listings for a total of 804 units for sale. Of those, 259 went pending and another 59 were removed for other reasons leaving 486 at the end of the month. The 59 removed for other reasons include those rented, expired or cancelled, or those temporarily off market.
Two notes about condo inventory. First, the data we utilize comes from the NWMLS database. Developers of new construction buildings only list a handful of units at any one time in the NWMLS, thus, the actual inventory is higher. Second, many new townhome developments are being built and classified as condominiums, so these are included in the condo inventory count.
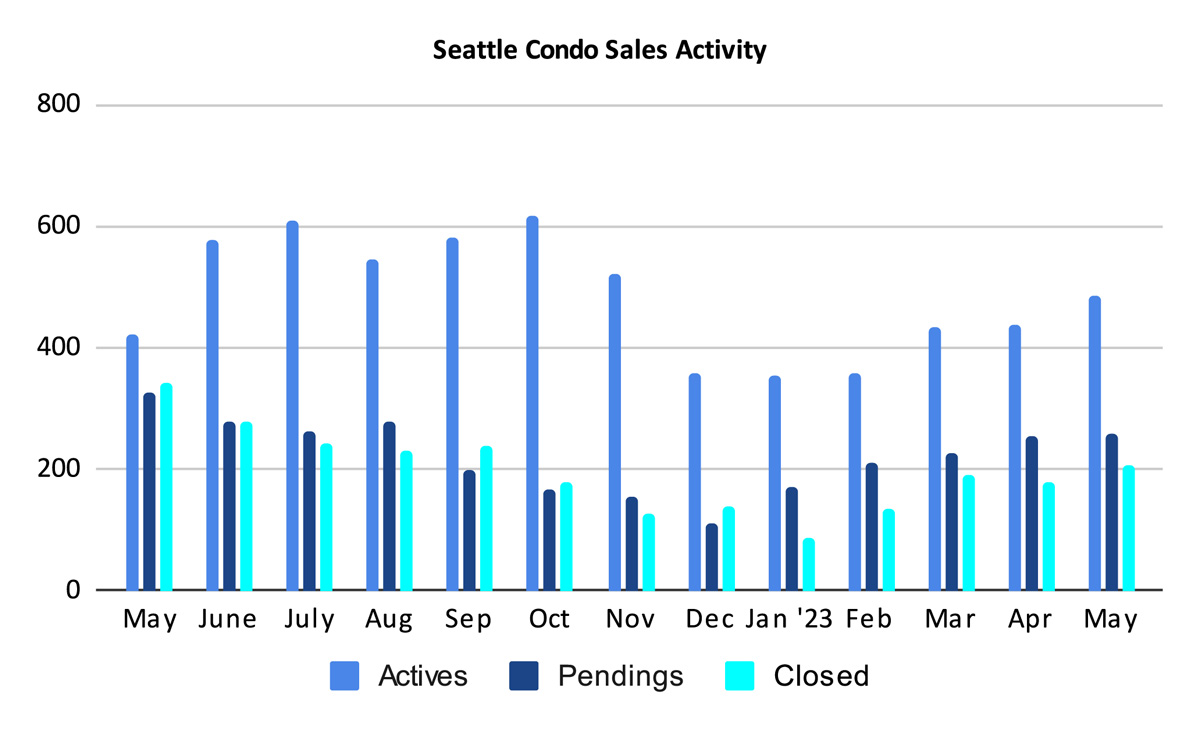
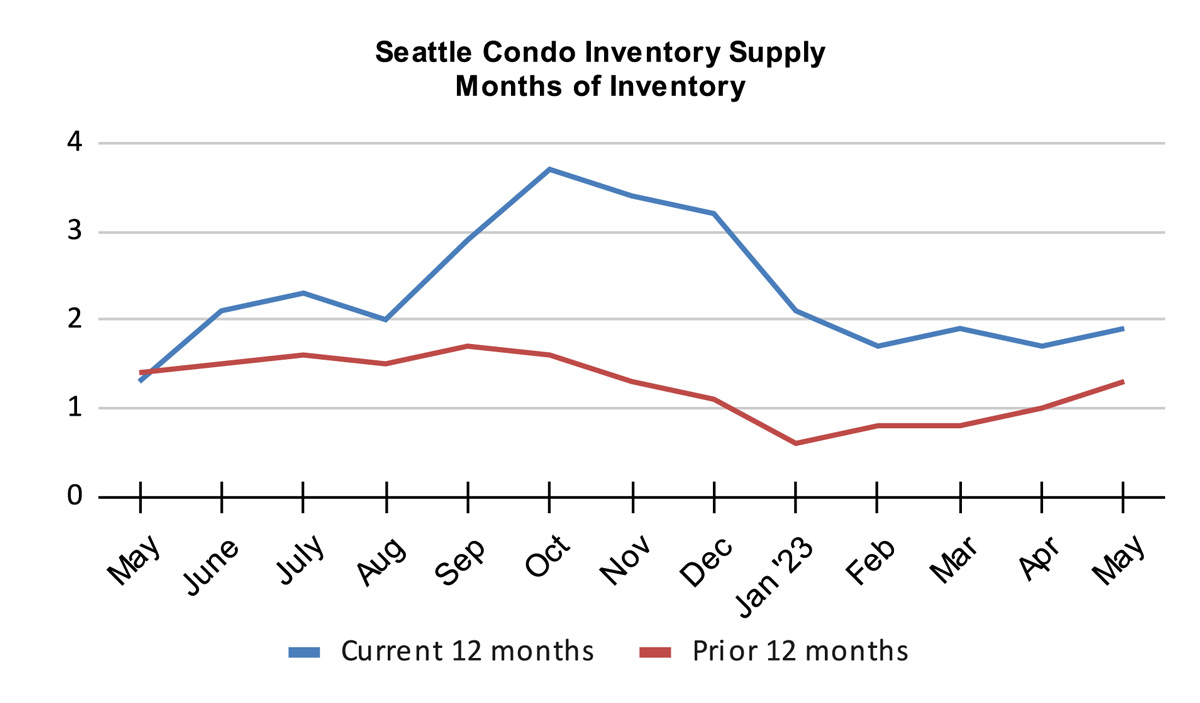
The combination of more active listings and fewer sales resulted in a slight increase to the inventory supply rate to 1.9-months of supply. Seattle remains in a seller’s market with the exception of downtown, which reflects a balanced-to-buyer’s market.
The supply rate metric is used to characterize the current condition of the market place. A supply rate of less than 4-months is a seller’s market. A rate between 4-7 months is a balanced or neutral market. And, over 7-months is a buyer’s market.
For perspective, Seattle’s condominium sector has been in a seller’s market for just over a decade now.
However, Seattle’s condo real estate activity varies by its neighborhood area micro-markets. For instance, the condo dense downtown / Belltown area is the most buyer friendly locale based on inventory supply. Though, it also has the highest selling prices, which depresses sales activity with many buyers priced out of the neighborhood.
On the other hand, the market is tighter in neighborhoods where there’s a dearth of condominium buildings, and often are more affordable, such as North Seattle.
Buyers will also encounter a more competitive environment based on price points. Currently, more affordable condos under $500,000 make up 31% of the available inventory. In May, 38% of the closed sales were priced under $500,000.
Conversely, condos over $1,000,000 make up 22% of the inventory but only 16% of the closed sales in May. When contemplating the unlisted luxury units at the new condo buildings, roughly 1 in every 4 condo units for sale is priced over $1,000,000.
Sales Activity Inches Up
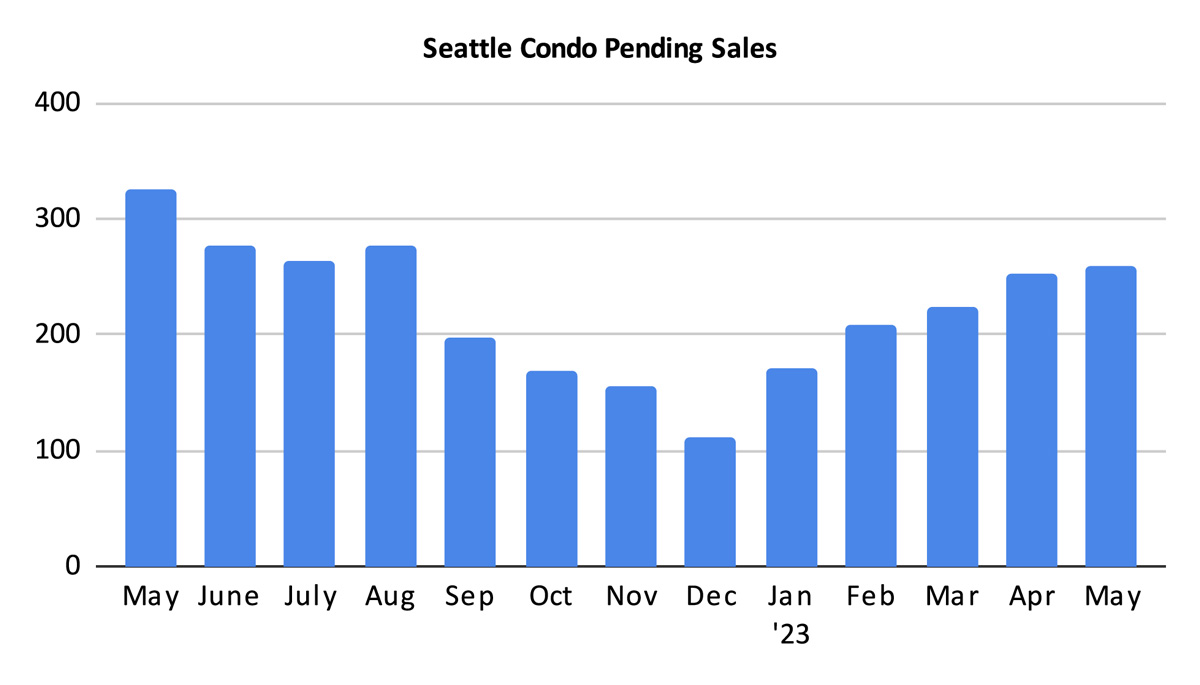
There were 259 pending sales transactions (properties in escrow) in May. That reflected a YOY decrease of 20.6% and a one-month increase of 2.4% in the number of pending unit sales.
High mortgage interest rates and the tech sector employment disruptions are likely the primary impediments on condo sales. And, to a lesser extent, the limited availability of affordable condo units for first-time homebuyers presents a barrier.
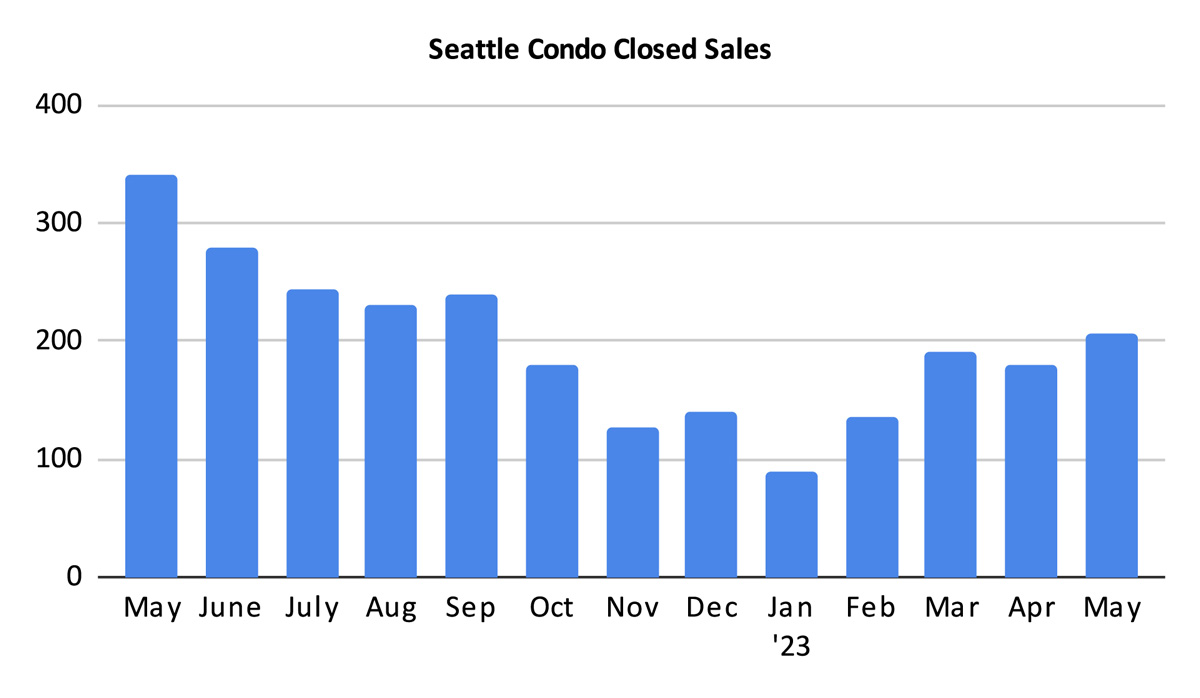
The 207 closed condo transactions in May reflected a one-year drop of 39.5%, but also a one-month improvement of 15%. Closings lag behind pendings by a month so we should see the same or slightly more closings in June.
Summary
Seattle’s condo market activity in May exhibited a bit of a mix bag depending on how you view the numbers. The year-over-year figures indicated the market underperformed in sales activity and selling prices compared to last May.
On the other hand, current trends are improving, though that is partly due to the cyclical nature of our market. Unit sales have been ticking upwards and values have improved.
Seattle notched the 2nd highest citywide condominium median sales price on record last month.
Nearly 1 in every 4 units for sale is priced $1,000,000 or higher. Where buyer demand is the greatest (under $500,000), those properties make up less than 1/3 of the available inventory.
The summer months typically exhibit a bit of a plateau in real estate market. The nicer weather, outdoor activities and vacations compete for home buyers time versus home searching. We should see some stability in the market place through the summer season when we typically experience a plateau in sales activity.
Seattle Condo Market Statistics May 2023
Source: Northwest Multiple Listing Service. Some figures were independently compiled by Seattle Condos And Lofts and were not published by the NWMLS.
© SeattleCondosAndLofts.com


