Seattle Condo Market Report – April 2023
Just like the weather the spring real estate season is slowing making an appearance upon Seattle’s condominium market. The April 2023 results for Seattle condos showed the market’s buoyancy with higher values, more sales activity and leveling inventory.
Condo Selling Prices Rise
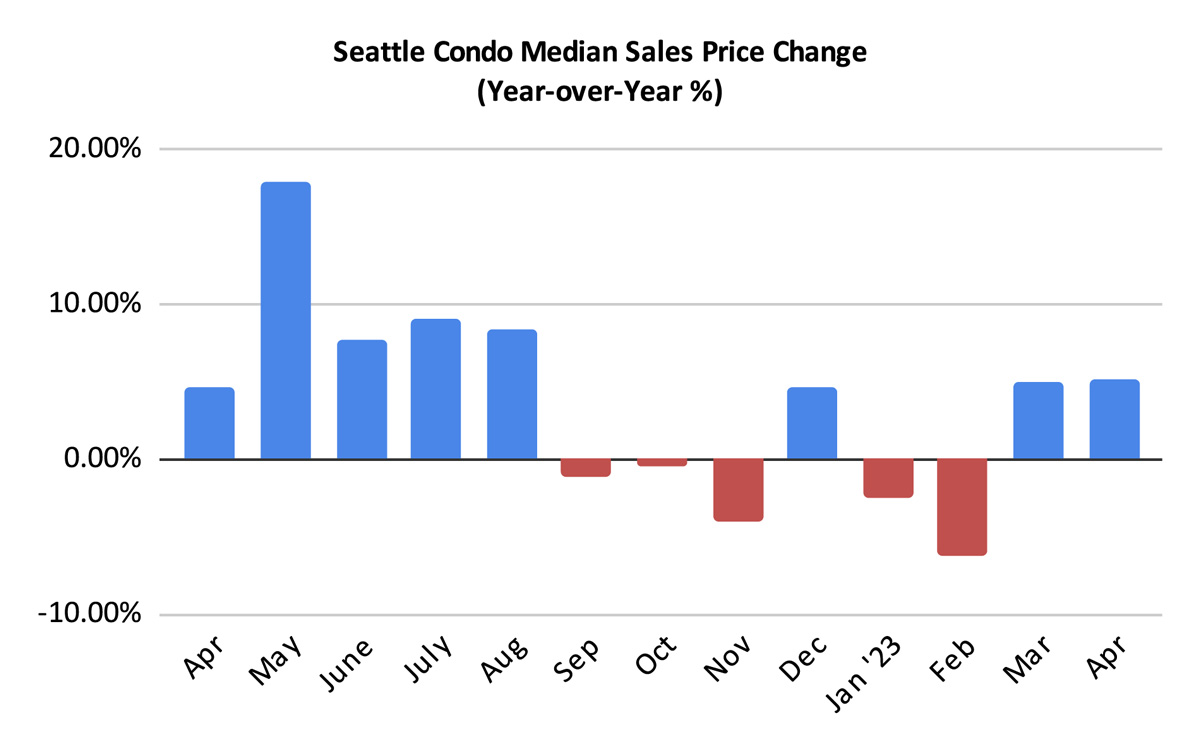
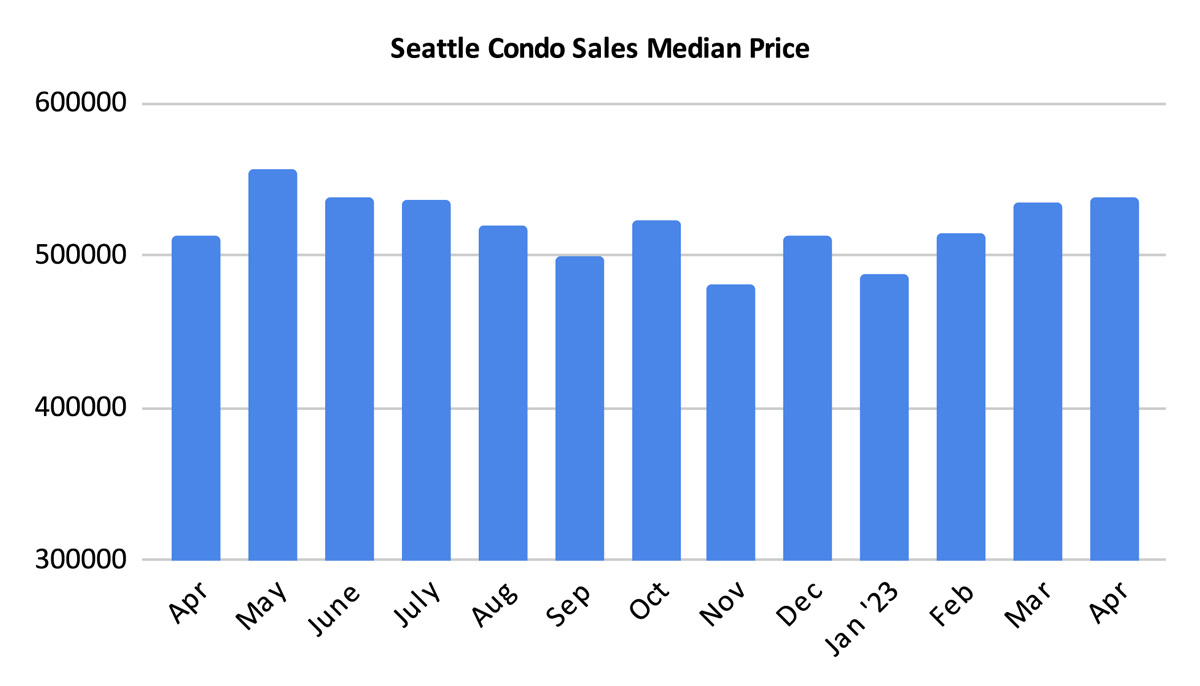
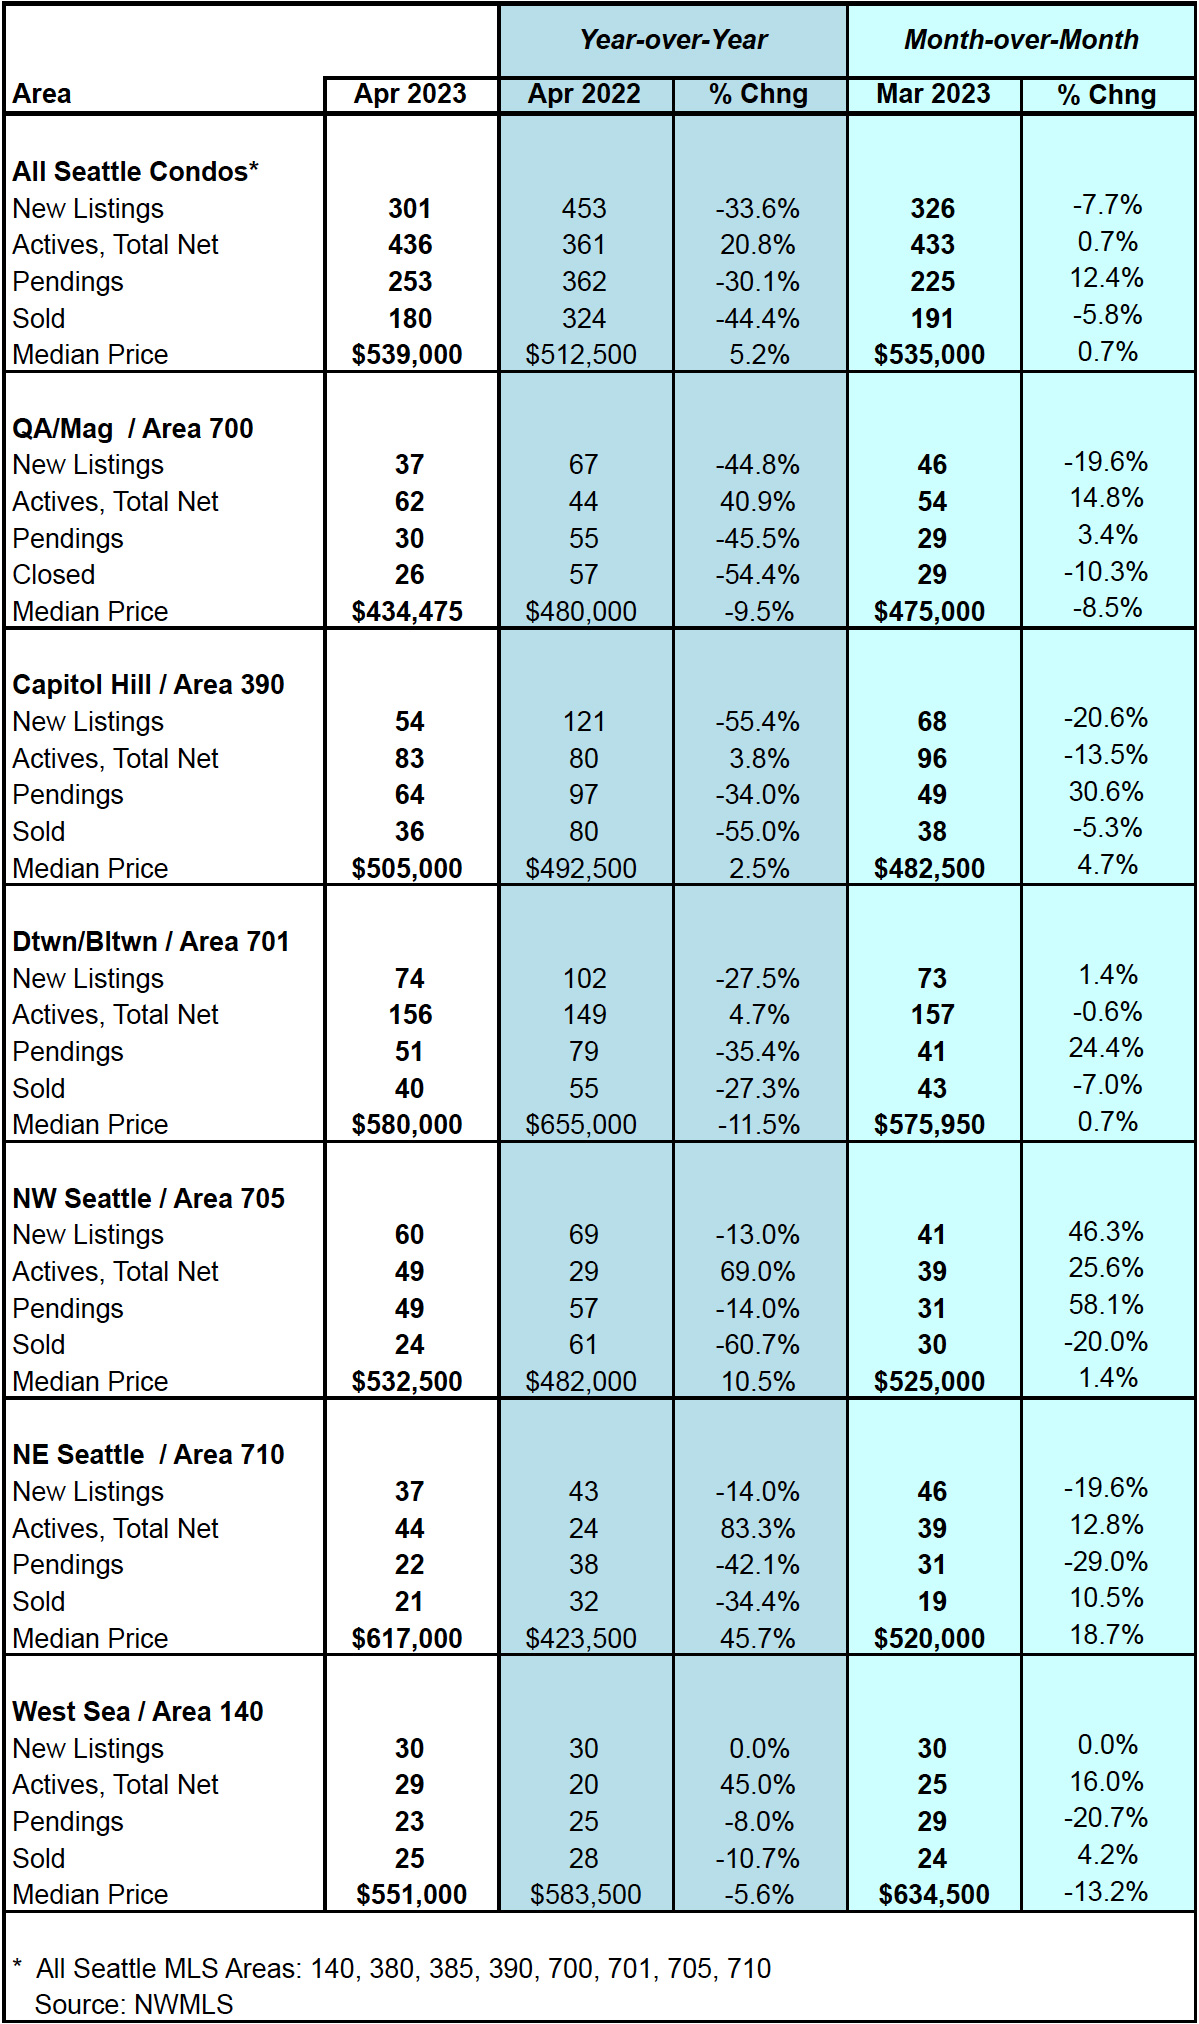
The citywide median sales price for Seattle condos was $539,000 in April, reflecting a year-over-year (YOY) increase of 5.2% and a one-month improvement of 0.7%. Although, just slightly higher than in March, it was the highest since May 2022. And, the 4th highest monthly median sales price on record.
By NWMLS neighborhood area, Capitol Hill / Central Seattle (2.5%), Northwest Seattle (10.5%) and Northeast Seattle (45.7%) showed YOY increases in their median selling prices. West Seattle (-5.6%), Queen Anne / Magnolia (-9.5%) and downtown (-11.5%) reflected decreases in their monthly median selling prices.
I previously mentioned that many new townhome projects are being developed and structured as condominiums. These are having an impact on the published statistics. Take Northeast Seattle for example. A handful of high-valued townhomes accounted for the area’s $617,000 median sales price for April. Excluding those, the median sales price would have been $510,500 for typical condo units. Though, that still would’ve been a considerable 20.5% increase YOY.
However, taking a look at Northwest Seattle, the results would have been reversed. Rather than a 10.5% YOY increase, excluding the newly built townhomes, it would have resulted in a -9.1% decrease in the median sales price.
New townhome developments in Northwest Seattle, which had an average sales price of $987,500, accounted for 35% of the condo sales in April. Thus, shifting the median point upwards.
View the complete neighborhood area results at the end of the post here.
Condo Inventory Plateaus
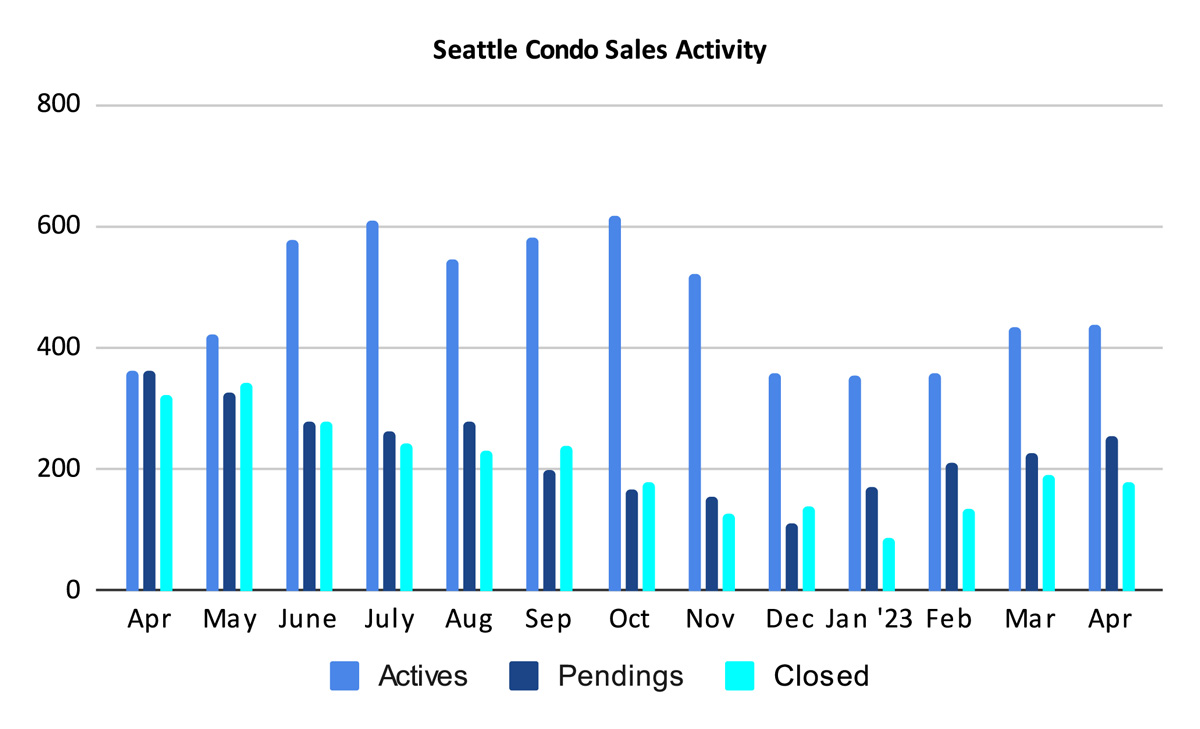
Seattle’s condo inventory stabilized for the month compared to March, up just 0.7% to 436 units at month’s end. That reflected 20.8% more than the same period last year, but that’s a much lower percentage than what we’ve been seeing for awhile.
The number of new listings added to market in April continued to do so at a decreasing rate. Last month there were 301 newly listed properties in Seattle compared to 453 last April. That’s a reduction in newly added listings of 33.6%. Relative to the previous month, there were 7.7% fewer newly listed properties as well.
(We started the month with 433 listings, then added 301 new listings and ended the month at 436 listings. A total of 298 listings were removed from the NWMLS, of which, 253 were pending sales. The remaining 45 listings were either cancelled, expired and/or rented.)
There are two caveats to note regarding the number of Seattle condo listings. First, this figure only includes properties listed for sale in the NWMLS. There are more units available, but unlisted, in the new downtown area condo buildings. So, actual inventory is a bit higher. Second, it includes townhomes that we don’t typically associate as condominiums, particularly small developments and stand alone townhomes.
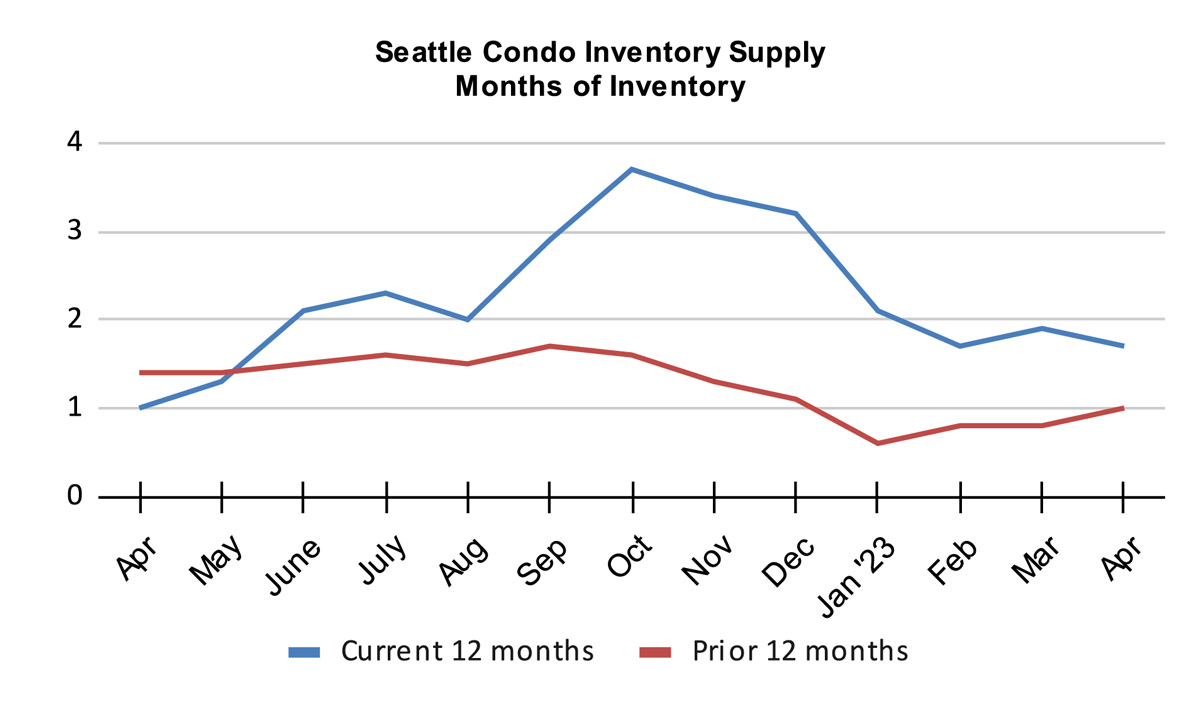
Seattle’s condo inventory supply tightened slightly last month to 1.7-months of supply based on pending transactions. The months of supply rate is a market condition metric. A rate of less than 4-months is characterized as a seller’s market. A rate between 4-7 months is a balanced market and over 7-months is considered a buyer’s market.
But what do we mean by 1.7-months of supply? If there were no new listings coming to market then buyer demand would exhaust the current supply of condos in 1.7 months, or roughly 50 days.
Seattle is a city of real estate micro markets, and the inventory supply rate varies by neighborhood & price points. For instance, condo dense downtown with more high-end units has a much higher supply rate and is more inline with a normal-to-buyer’s market. On the other hand, Northwest Seattle, with less stock was essentially at zero months of supply in April, is a very tight seller’s market.
Inventory supply can also be expressed as the absorption rate, which was 58% in April.
Condo Sales Activity Improves
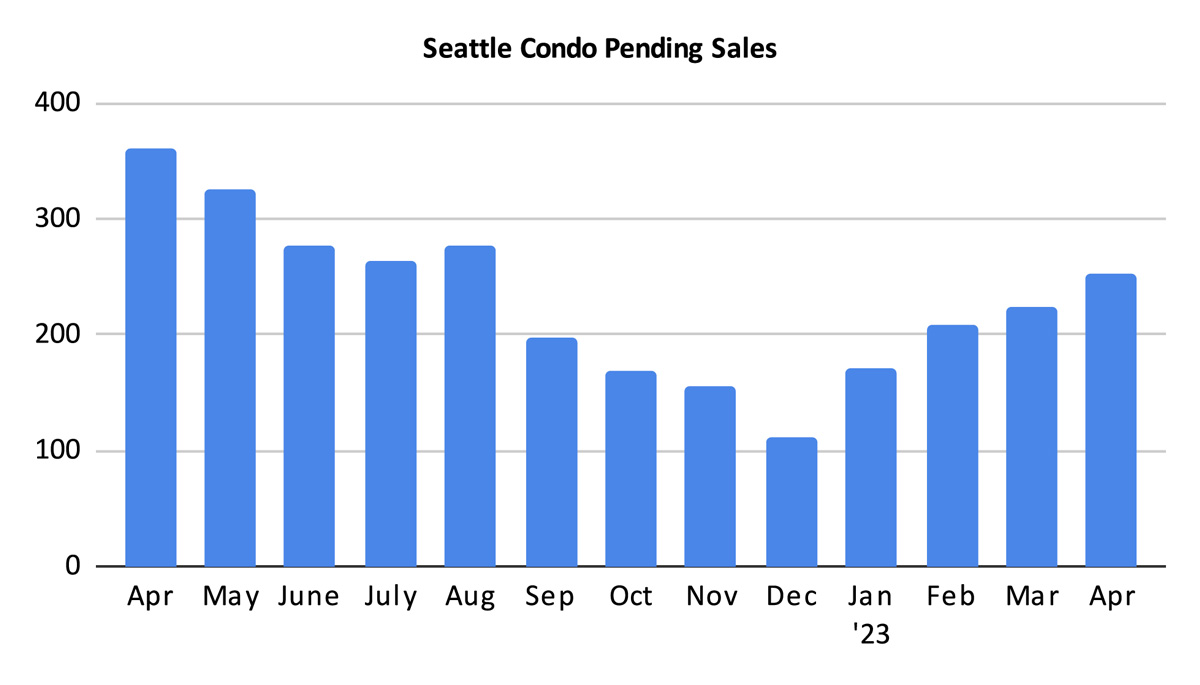
There were 253 pending condo transactions (listings in escrow) in April. That reflected a one-year decrease of 30.1%, but also a one-month increase in sales of 12.4%. We’re underperforming last year’s levels but are trending upward.
Historically, sales activity flourishes during the spring season. So far, Seattle is keeping to the cyclically trend this year, which is a relief considering we had the opposite experience last year.
There are adverse forces affecting the market – interest rates, condo underwriting guidelines, employment trends and the economy. Fortunately, there are positive factors as well. We have strong local economy, the city’s commitment to reviving downtown and major tech companies pursuing return to work policies. The latter may encourage more condo sales in the city core areas – downtown, Belltown, Queen Anne, Lake Union and Capitol Hill.
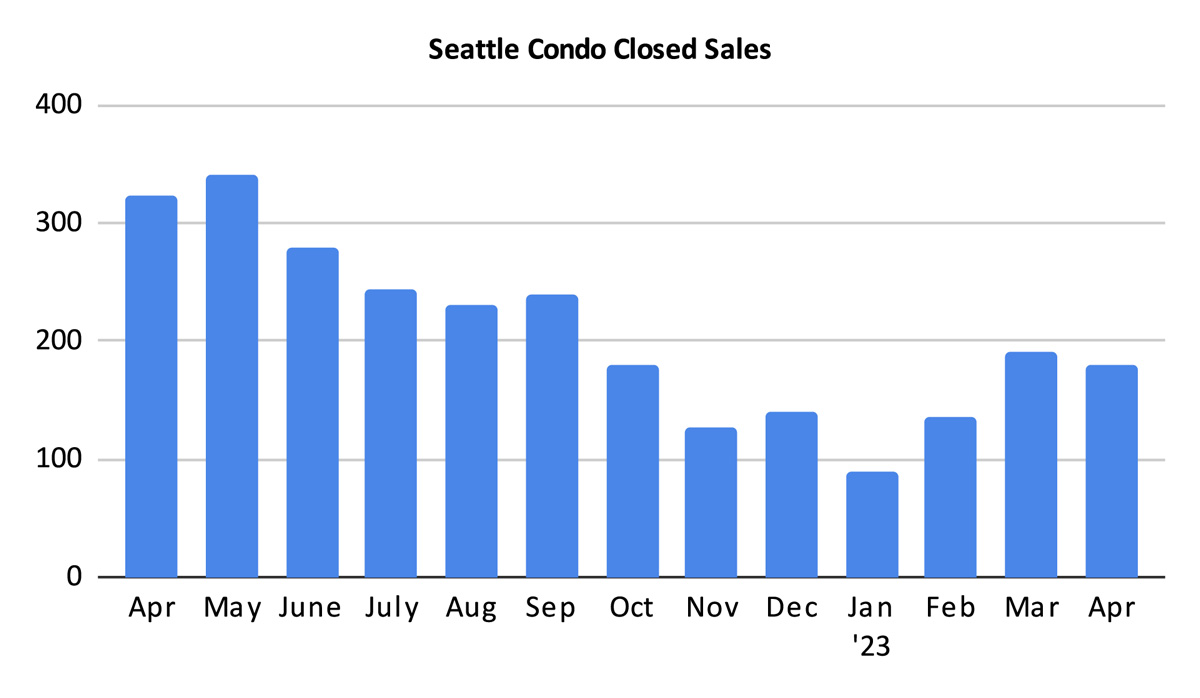
The 180 closed condo sales in April reflected a year-over-year and a one-month decrease of, 44.4% and 5.8%, respectively. Closing follow pendings by roughly 30-days, so we should see this number increase in May.
Summary
April exhibited the buoyancy of Seattle’s condominium market. The citywide median sales price increased overall to the 4th highest on record. But, the results were partially skewed by the rising number of new townhome developments structured as condominiums.
The number of condo listings plateaued in April, earlier than we normally expect. On the other hand, sales activity picked up, which tightened the inventory supply rate.
We are at the peak seasonal period of the Seattle real estate market. For the most part, the market is performing as we’d expect but at a more subdued level. We anticipate more of the same for the coming months until we hit the summer plateau period.
Buyers may find themselves in a more competitive situation. Anecdotally, some buyers have encountered bidding wars with escalation clauses and pre-inspections. Although, that’s not common and will depend on neighborhood and price points.
Sellers are starting to experience shorter days on market timeframes and higher selling prices. But, again, that will depend on neighborhood location and price point.
Seattle Condo Market Statistics April 2023
Source: Northwest Multiple Listing Service. Some figures were independently compiled by Seattle Condos And Lofts and were not published by the NWMLS.
© SeattleCondosAndLofts.com


