February 2020 Seattle Condo Market Report

Leap year was especially fruitful for Seattle’s condominium market place as median sale prices and unit sales activity shook off the winter doldrums.
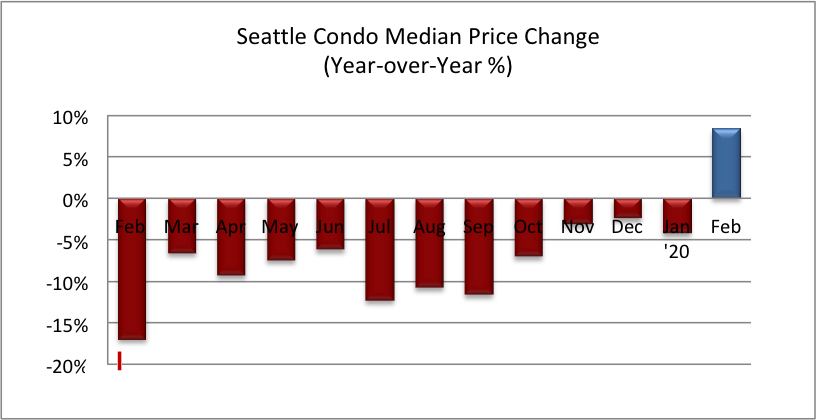
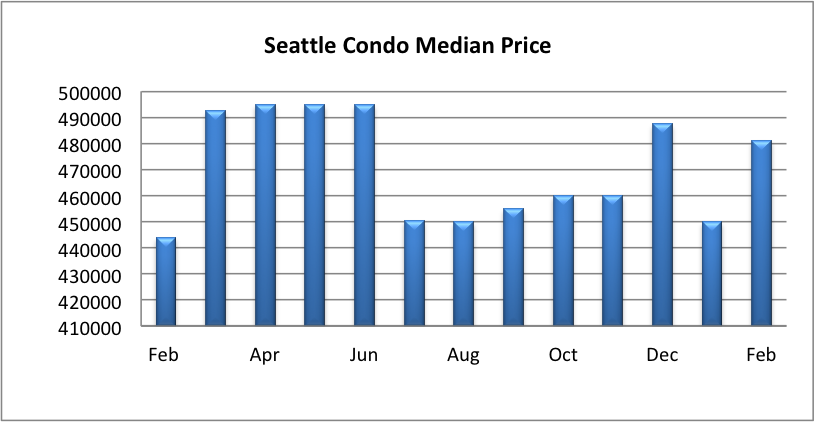
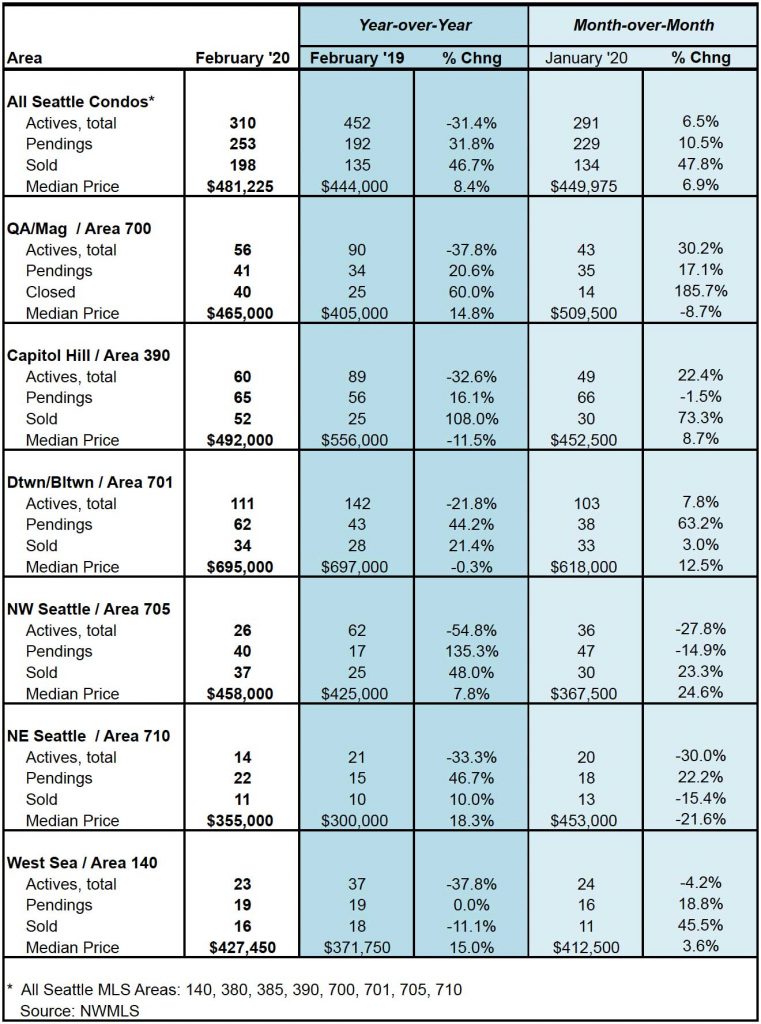
The citywide median condo sales price rose 8.38% year-over-year (YOY) and 6.9% over the prior month to $481,225. While rising median sales prices are cyclically typical during Seattle’s peak spring selling season, the YOY result is especially noteworthy as it reversed a 13-month run of YOY decreases.
Year-over-year median sale prices improved throughout Seattle with the exception of Capitol Hill / Central and downtown areas, while West Seattle, Queen Anne and Northeast Seattle realized double-digit increases. See table at bottom of post for more neighborhood information.
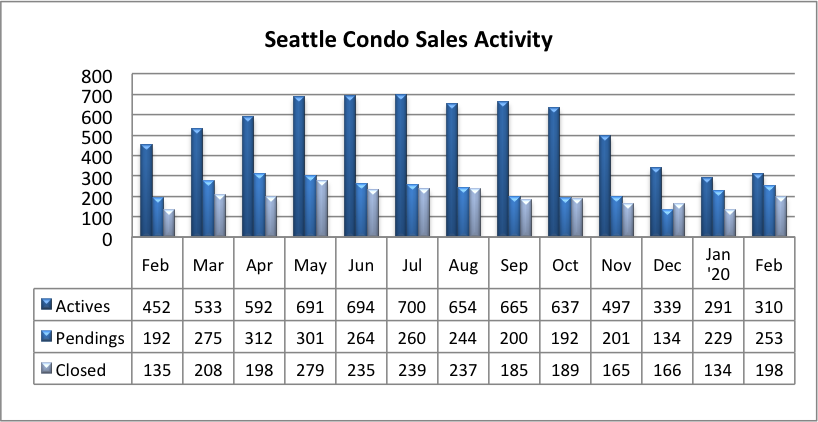
The number of NWMLS listed Seattle condos for sale continued to stagnate with 310 units that reflected a 31.4% reduction from last February. Though, as expected, it did increase slightly by 6.5% over the prior month.
We will continue to see listings increase during the spring season, but I anticipate we’ll be well below last year’s availability.
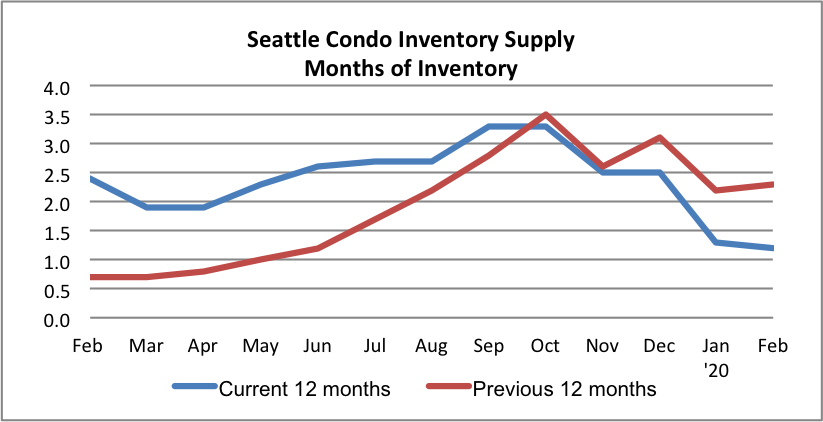
Even though there were more listings in February over January, the inventory supply dropped to 1.2-months of supply on the strength of sales activity.
The inventory supply metric illustrates the current housing market environment. A supply rate of less than 3 months is characterized as a seller’s market, a rate of 4 to 6 months being a normal/balanced market, while a rate of over 6 months is considered a buyer’s market.
Seattle’s condo market has essentially been in a seller’s market for the past 8 years, ever since the market bottomed in 2012.
Two notes about Seattle’s condo inventory. First, we’re basing our calculations on NWMLS’ listed properties. The NWMLS does not contemplate under-construction presale condo units available for purchase. Second, with new construction buildings completing (e.g. Nexus), we will see flipped investor units enter the market place, which may help ease our inventory shortage.
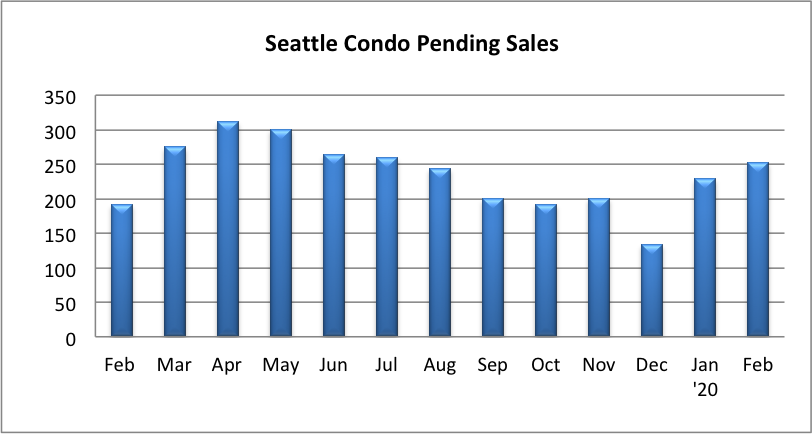
The number of pending sales transactions rose as we’d expect, increasing 31.8% YOY to 253 units, and 10.5% more than the prior month. We’ll continue to see pending transactions (listings under contract) trend upwards through summer.
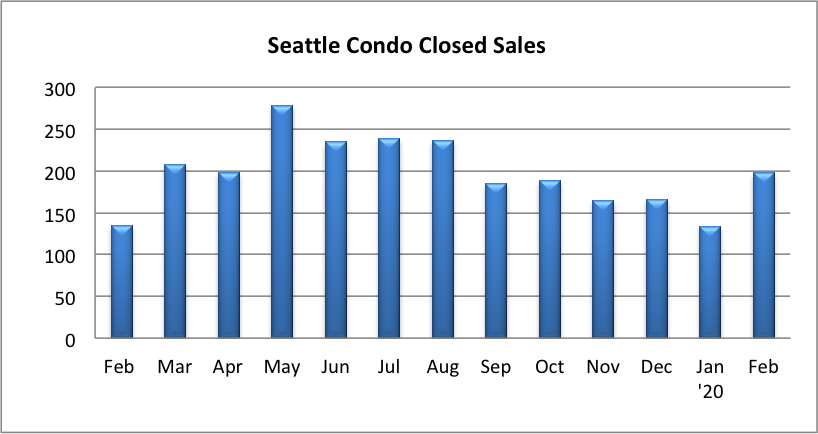
With the strong number of pendings back in January, closed sales transactions for February spiked 46.7% over the same prior last year and 47.8% over last month to 198 units. As with pendings, the number of closed sales will continue to rise throughout the peak spring season.
So, what does this mean if you’re a buyer or a seller?
Anecdotally, we’re starting to see more listings with offer review dates (less than 10 days on market), multiple offer bidding wars with escalating prices and buyer pre-inspections done prior to making an offer. Though, that is dependent on price point, location and condition of the property.
The average cumulative days on market for Seattle condo properties sold (closed) in February 2020 was 73 days, while it was 72 days in February 2019. However, 33% of condos sold less than 10 days in February 2020 versus 24% in February 2019. I suspect we’ll see the days on market shrink considerably in the coming months.
Additionally, condos selling in less than 10 days, on average, sold for 1.74% over the list price compared to -0.44% for all condos sold in February 2020.
Whether your looking to purchase a Seattle condo or sell your unit, our team can assist you with your options in this rapidly changing market.
Source: NWMLS. Some figures were independently compiled by SeattleCondosAndLofts.com and were not published by the Northwest Multiple Listing Service.
© SeattleCondosAndLofts.com


