Seattle Condo Market Recap May 2025

Seattle’s condominium market ended Spring on a bit of a down note. Median selling prices tumbled and the number of listings rose to a near 14-year high. On a positive note, condo sales activity improved for the month.
Selling Prices Soften
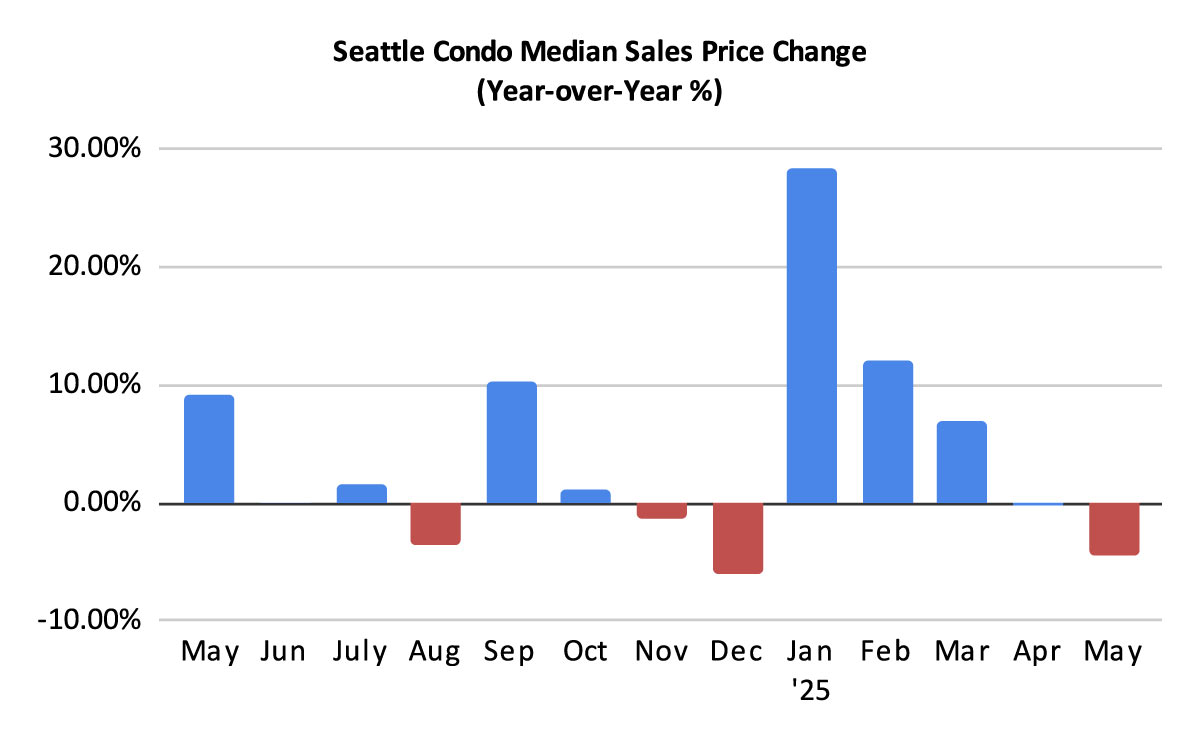
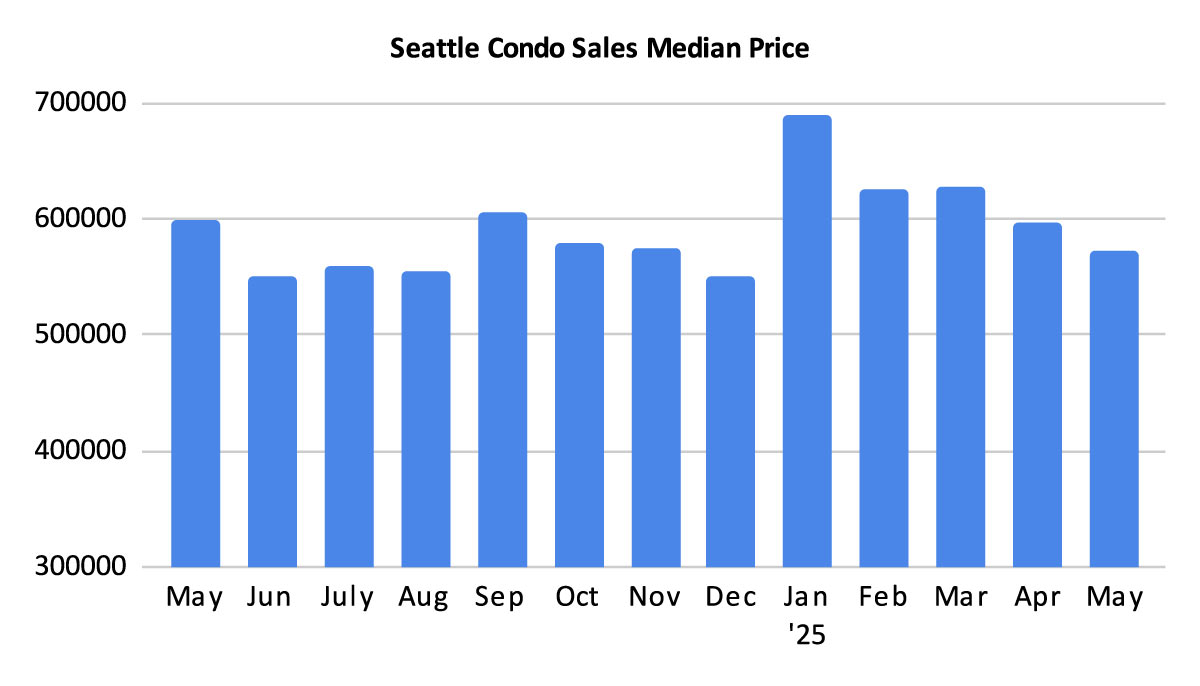
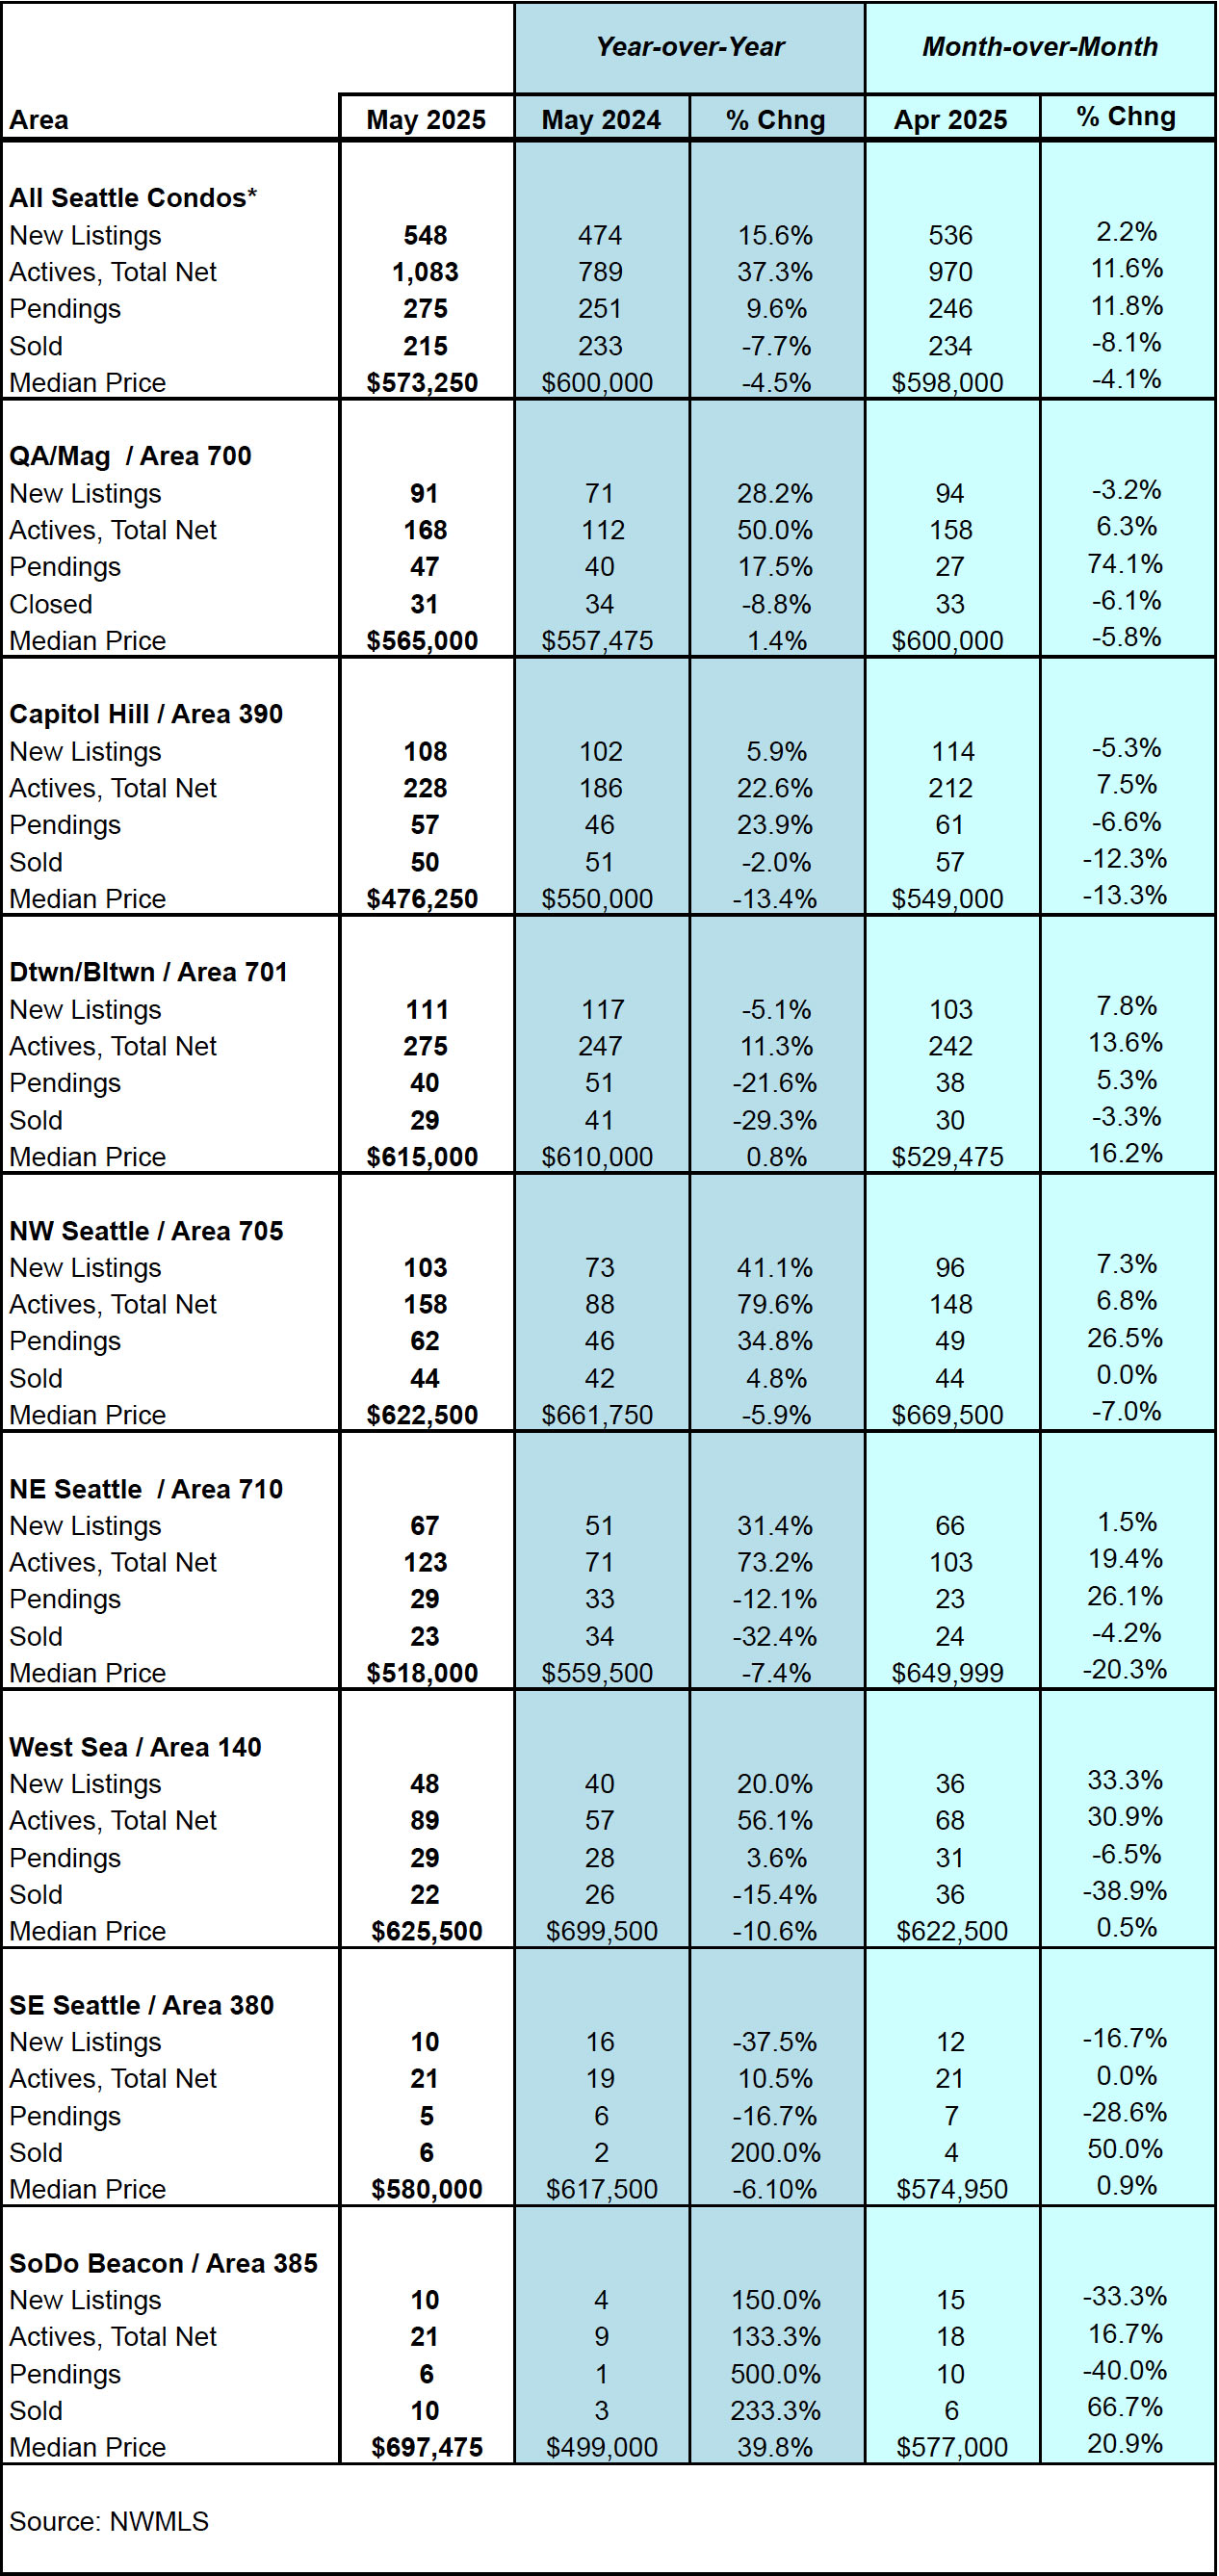
The Seattle citywide condominium median sales price slipped slightly to $573,250, a year-over-year and a month-over-month decrease of 4.5% and 4.1%, respectively.
By NWMLS neighborhoods areas, most had reflected a year-over-year decline – Capitol Hill / Central (-13.4%), West Seattle (-10.6%), Northeast Seattle (-7.4%), Southeast Seattle (-6.1%) and Northwest Seattle (-5.9%). The bright spots were South Seattle (+39.8%), Queen Anne / Magnolia (+1.4%) and downtown (+0.8%). View complete neighborhood statistics for May at the end of the post.
The citywide median selling price is based on all condo sales in May. However, the NWMLS has a broad classification for condominiums and include properties that are not traditionally thought of as a condo. These include older single family houses that have been “condoized” when an Accessory Dwelling Unit (ADU) and/or a Detached Accessory Dwelling Unit (DADU) has been added to the lot, the plethora of townhomes, and boat moorages.
These non-traditional condos comprised 29% of all condo sales in Seattle in May with an $825,000 median sales price. If we exclude these and focused on solely on traditional condo unit sales, the citywide median sales price would have been $466,250 last month. And, that’s not very good news. That reflected a one-year drop of 11.2% compared to last May and a 14% decrease from April.
Listings Keep Rising
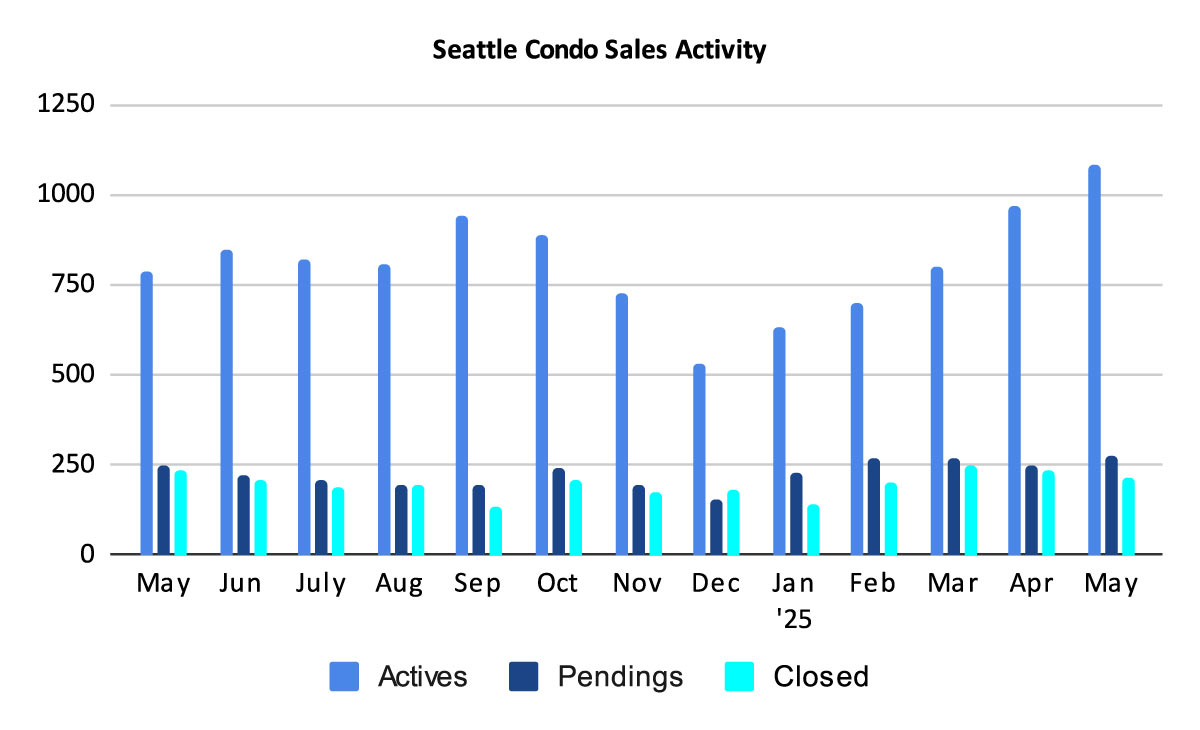
The number of NWMLS listed Seattle condos for sale rose in May to 1,083 units, an increase of 37.3% over the same period last year and 11.6% more than the prior month. This also represented the most units listed for sale in the NWMLS in nearly 14 years…back to July 2011.
We started the month with 970 listings and sellers added an additional 548 new listings in May for a total of 1,518 units. Of that total, 435 listings came off the market (e.g. they sold, were cancelled or expired, were rented instead, or were temporarily paused). That left 1,083 at month’s end.
As of the date of this posting, traditional condos make up 77.4% of the listed inventory while non-traditional condos account for 22.6%. A year ago, non-traditional condos comprised 14.2% of the condo inventory.
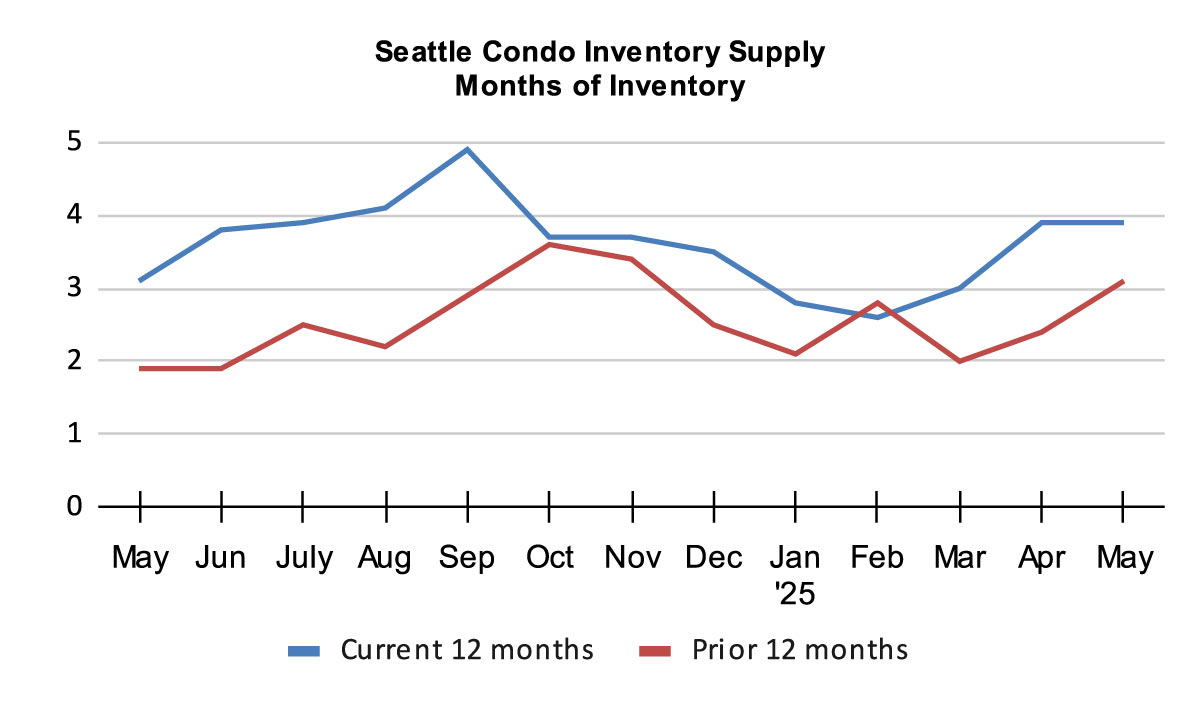
Even though the number of listings increased in May, the Seattle condo inventory supply rate remained the same at 3.9-months of supply. That’s right on the cusp of a balanced, or normal, marketplace. That was due to a slight surge in condo sales last month.
The inventory supply rate is a metric to classify the real estate market environment. The supply rate is calculated by dividing the number of listing by the number of pendings for the month. Theoretically, the supply rate measures how long it will take, at the current rate of sales, to exhaust the current supply. In this case 3.9-month. The supply rate can also be calculated using closed sales instead of pending transactions.
A rate of less than 4-months of supply is considered a seller’s market. A rate from 4 to 7-months of supply is a balanced or normal real estate market, and a rate greater than 7-months would be a buyer’s market.
Seattle is comprised of neighborhood and price point micro markets, so buyers and sellers will experience varying environments. Most of the city is on the cusp, however, two areas are a bit of an outlier. Northwest Seattle has a supply rate of 2.5-months, which is considered a seller’s market, while downtown is at 6.9-months, essentially a buyer’s market.
Supply can also be referenced as an absorption rate, which was 25.3% last month. A rate of less than 20% indicates a normal / balance market.
Sales Surge
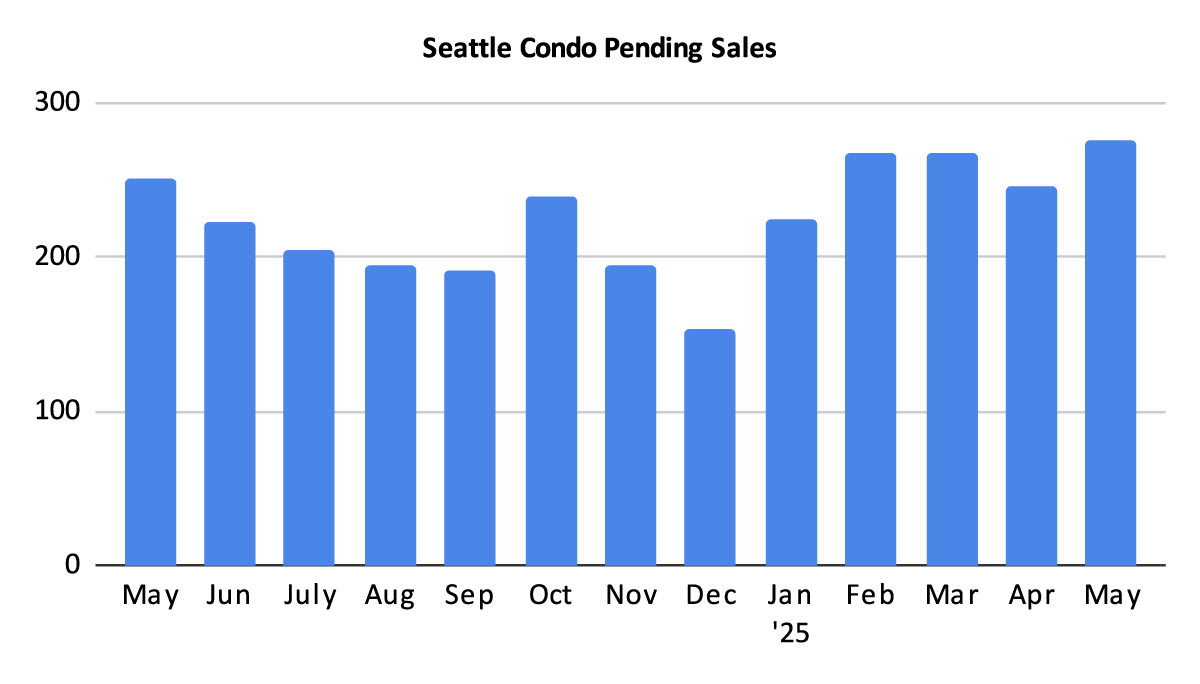
The inventory supply rate had remained unchanged due to an uptick in condo sales in May. Buyers placed 275 units in pending status (under contract in escrow), which represented a one-year bump of 9.6% and a one-month increase of 11.8%.
Perhaps having more choices, a softening market with stronger negotiating position, and fairly stable interest rates, buyers came off the fence and put their purchasing power to use. As a whole, condos sold at 98.3% of their list price in last month.
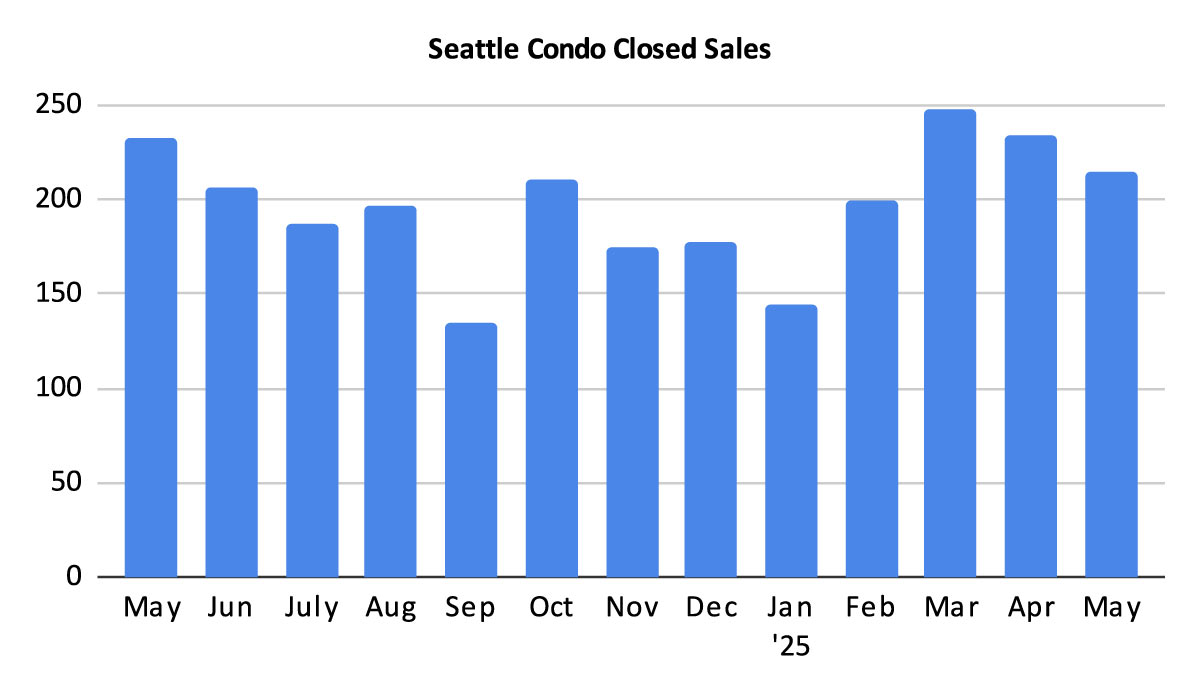
There were 215 condo closing in May, exhibiting a year-over-year dip of 7.7% and a one-month drop of 8.1%. That might bump up in June given the greater number of pendings in May.
In summary…
While Seattle basks in the sunny, warm Pacific Northwest weather, the condo market turned a bit gloomy in May. The number of condo listings rose to a 14-year high as median selling prices tumbled. Fortunately, brisk condo sales kept the market afloat.
Typically, the Seattle’s real estate market plateaus during the summer season before a downshift during the Fall. However, the market appears to have softened a bit early. Fortunately, for now, as listings rise and prices fall, sales activity has increased.
Seattle Condo Market Statistics May 2025
Source: Northwest Multiple Listing Service. Some figures were independently compiled by Seattle Condos And Lofts and were not published by the NWMLS.
© SeattleCondosAndLofts.com