Seattle Condo Market Update February 2021
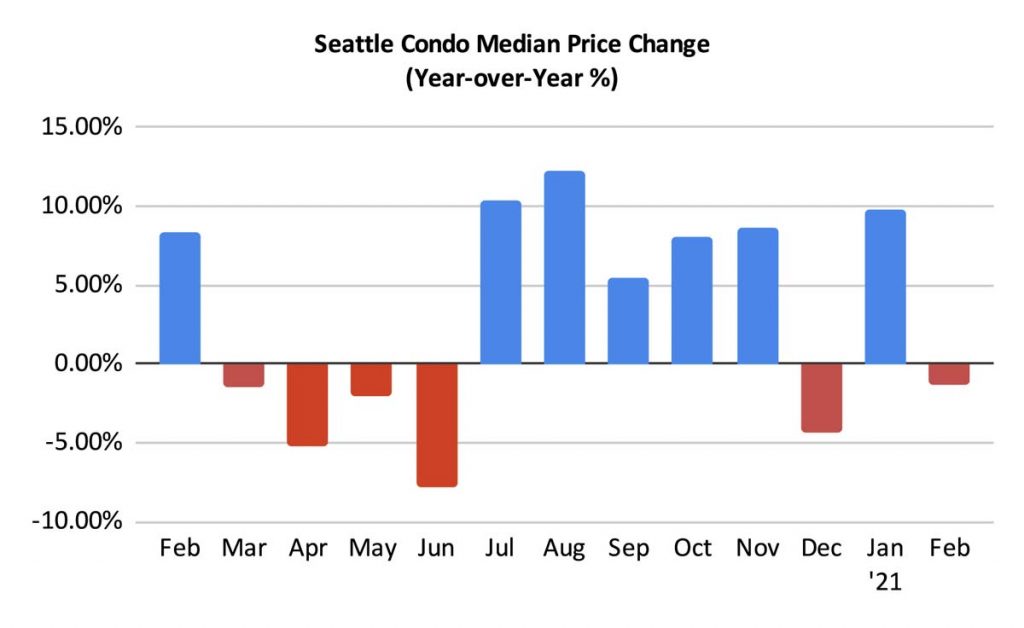
Seattle has been a tale of two markets, the super hot single family houses / townhomes and the more tepid condo market. Condo sale prices dipped in February even as unit sales activity increased while single family properties saw huge gains in sales and prices.
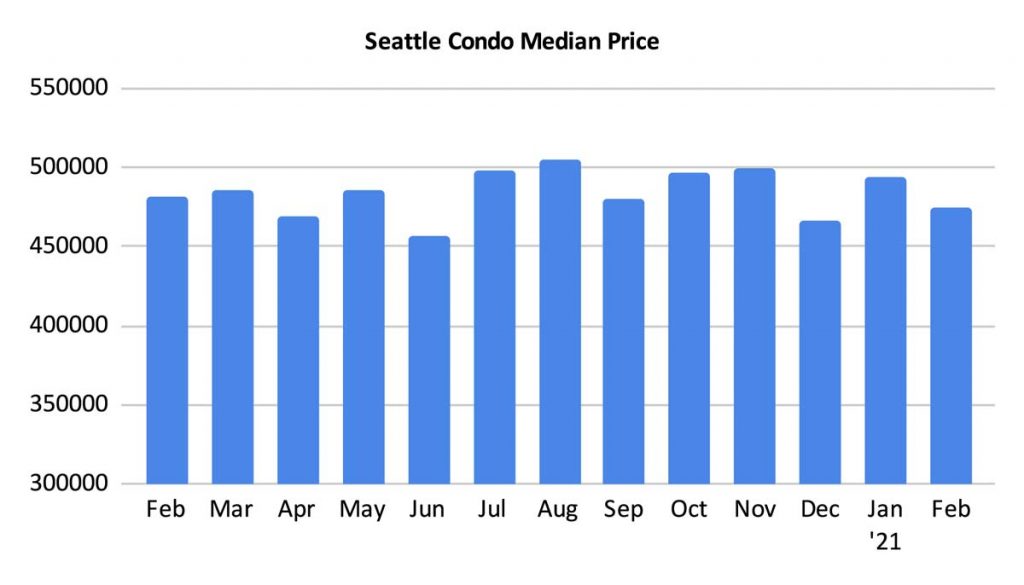
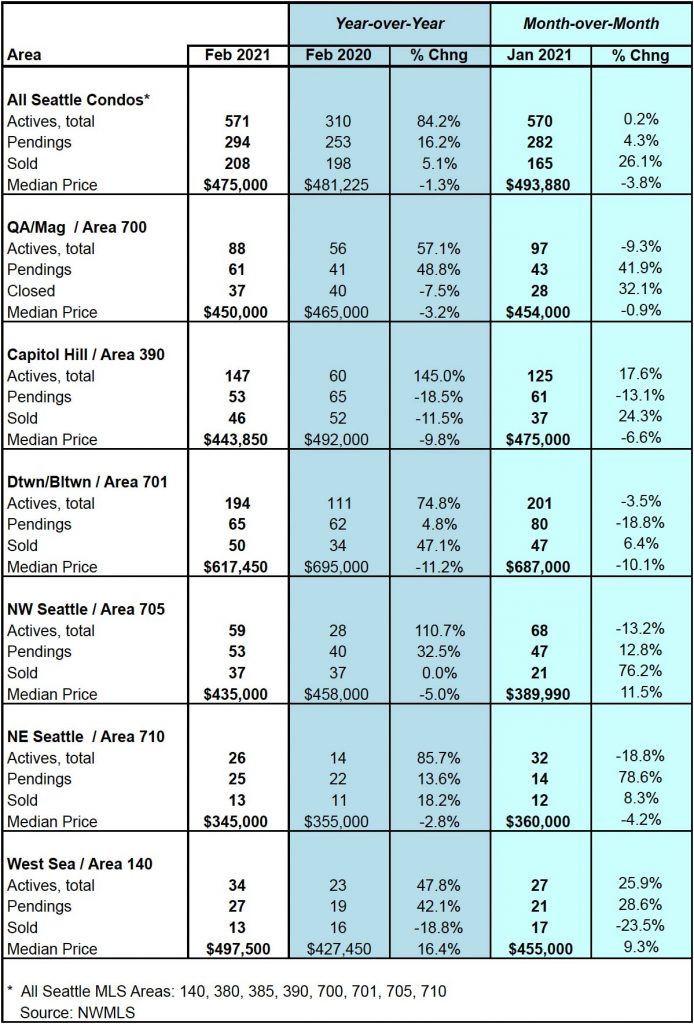
The February Seattle citywide condo median sales price was $475,000, which represented a 1.3% year-over-year and a 3.8% month-over-month decrease, respectively. The median single family property sales price was $798,000 last month, up 9.2% over the same period last year.
Overall, sale prices were down YOY throughout Seattle with the exception of the West Seattle area, which realized a 16.4% YOY improvement. However, diving into the West Seattle sales, there were more Alki condos (higher valued units) that sold in 2021 vs 2020 which moved the median/mid-point upwards, rather than appreciation.
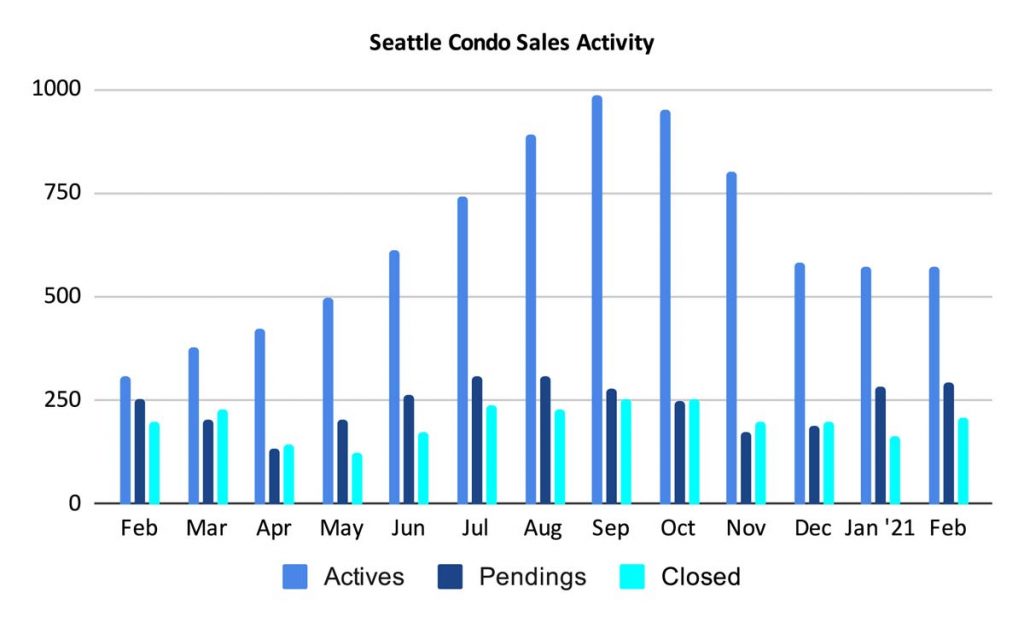
Interestingly, Seattle condo listings have started to stabilize over the past few months. Historically, we’d normally experience an uptick in listings as we progress through spring. However, we had 570 condo units listed for sale in the NWMLS last month, which was on par with January, and fewer than we had in December.
Granted, this is 84% more than we had during the same period last year, and we also have a number of new construction units available for purchase that are not listed for sale in the NWMLS.
By comparison, the single family housing market had just 474 listings available in Seattle last month.
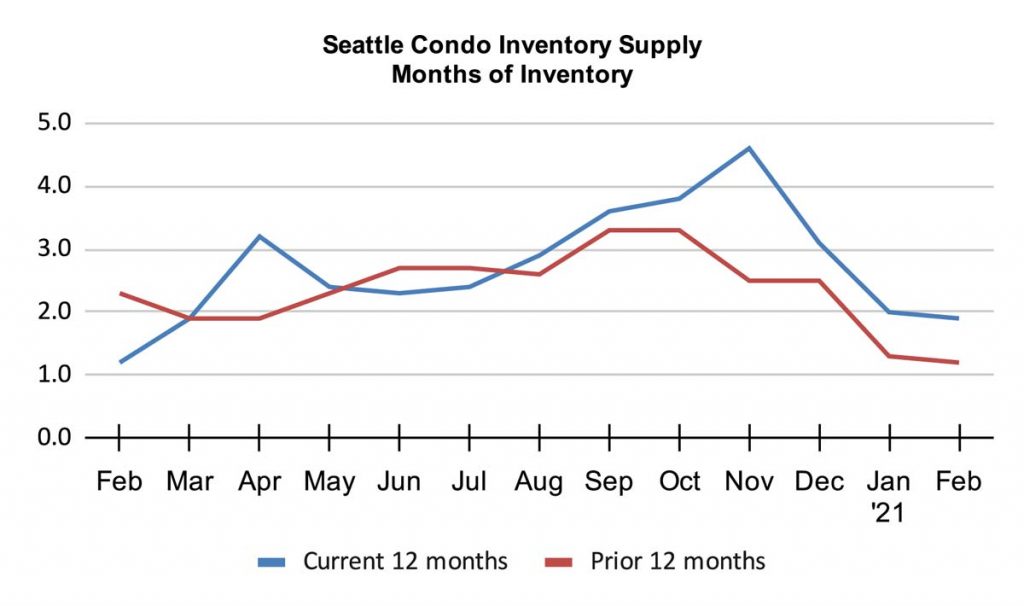
With listings holding steady combined with the increase in unit sales, the Seattle condo inventory supply rate decreased to 1.9-months of supply. At this rate, Seattle as a whole, remains in a seller’s market.
However, individual neighborhoods are experiencing varying conditions. High condo dense areas such as downtown have a higher supply rate, particularly with the abundance of new construction options.
On the other hand, new listings barely kept up with buyer demand north of the ship canal last month, where the supply rate dropped to a near 1-month supply. For instance, there were 59 listings with 53 sales in NW Seattle and 26 listings with 25 sales in NE Seattle.
The inventory supply rate metric characterizes the market environment. A rate of less than 3-months is a seller’s market, 3-6 months a normal or balanced market, and over 6 months would be classified a buyer’s market. The supply can be calculated by either utilizing pending sales or closed sales; we utilize pending sales for our calculations.
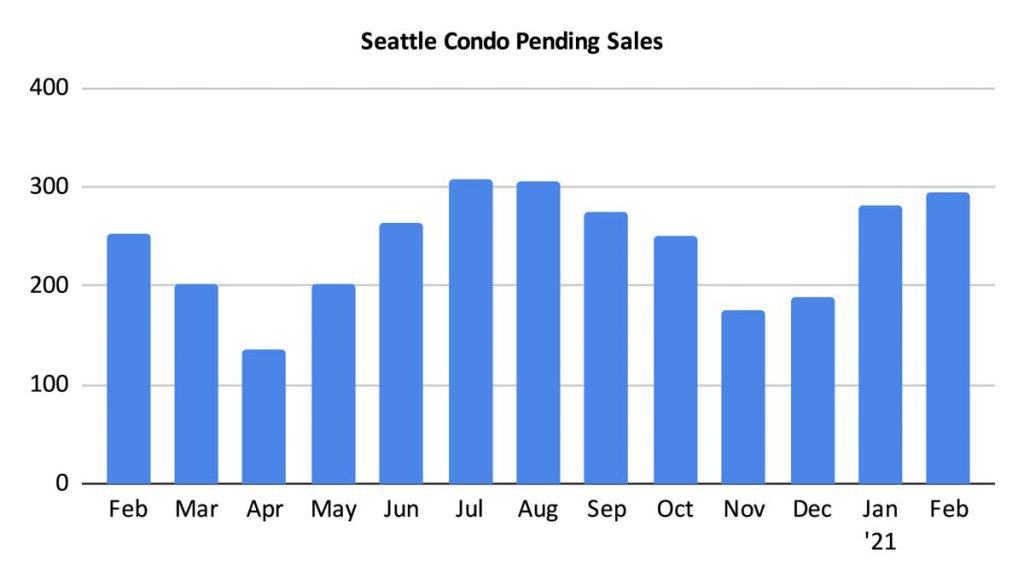
The number of pending sale transactions improved in February, increasing 16.2% YOY and 4.3% from the prior month to 294 units.
With the pandemic hitting the market last spring, we’ll see huge gains in pendings over the next few months by comparison.
The number of closed Seattle condo unit sales also increased last month, rising 5.1% YOY and 26.1% MOM, to 208 units. That will continue to rise as we move forward through the spring months.
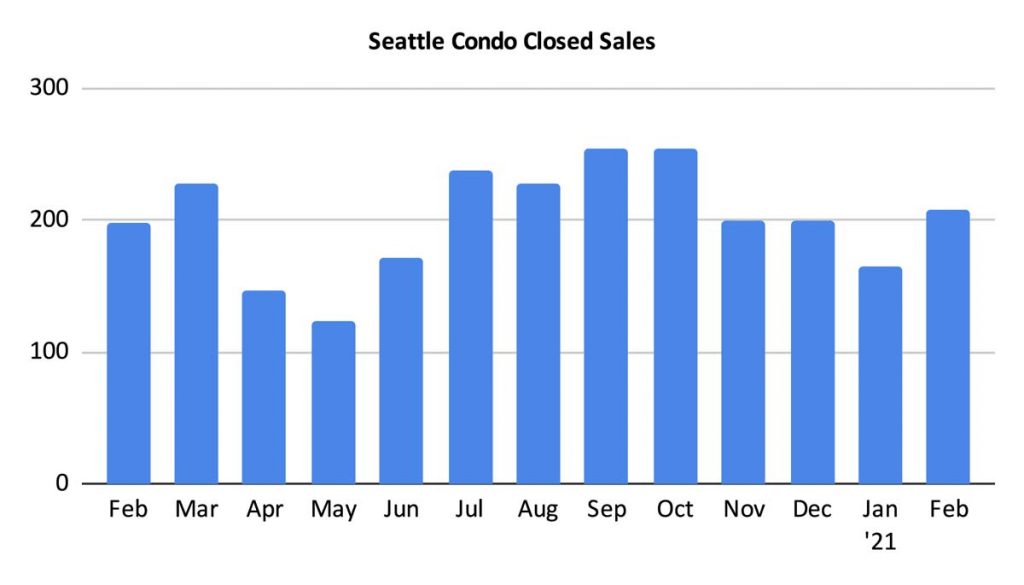
Based on where the Seattle condo market was heading last year, 2021’s outlook was somewhat bleak. In some cases that has been true with fluctuating selling prices and market time lags depending on area. However, strong sales velocity and stabilizing inventory and mortgage interest rates have kept the market in a strong position overall, but not as robust as the single family market place.
As noted in table below, the market has tightened, especially in north and West Seattle. Even downtown improved with a balanced market condition based on listed properties (technically, more of a buyer’s market given unlisted new construction inventory).
Prices should improve as well. Condos are starting to sell with shorter days on market timelines, which likely indicates selling prices that are closer to list.
Source: Northwest Multiple Listing Service. Some figures were independently compiled by SeattleCondosAndLofts.com and were not published by the NWMLS.
© SeattleCondosAndLofts.com


