Seattle Condo Market Recap – June 2025

Seattle’s condominium market had a bit of a respite in June. Condo median selling prices rose, sales outpaced last year and inventory dipped for the month.
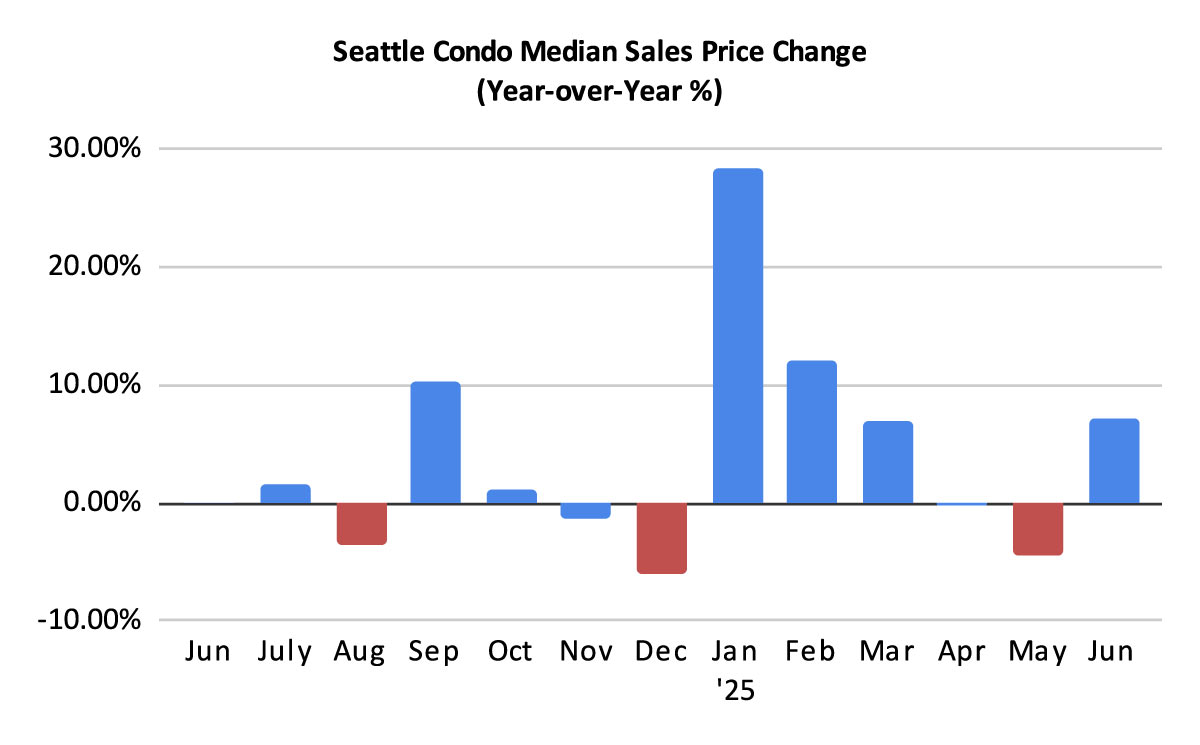
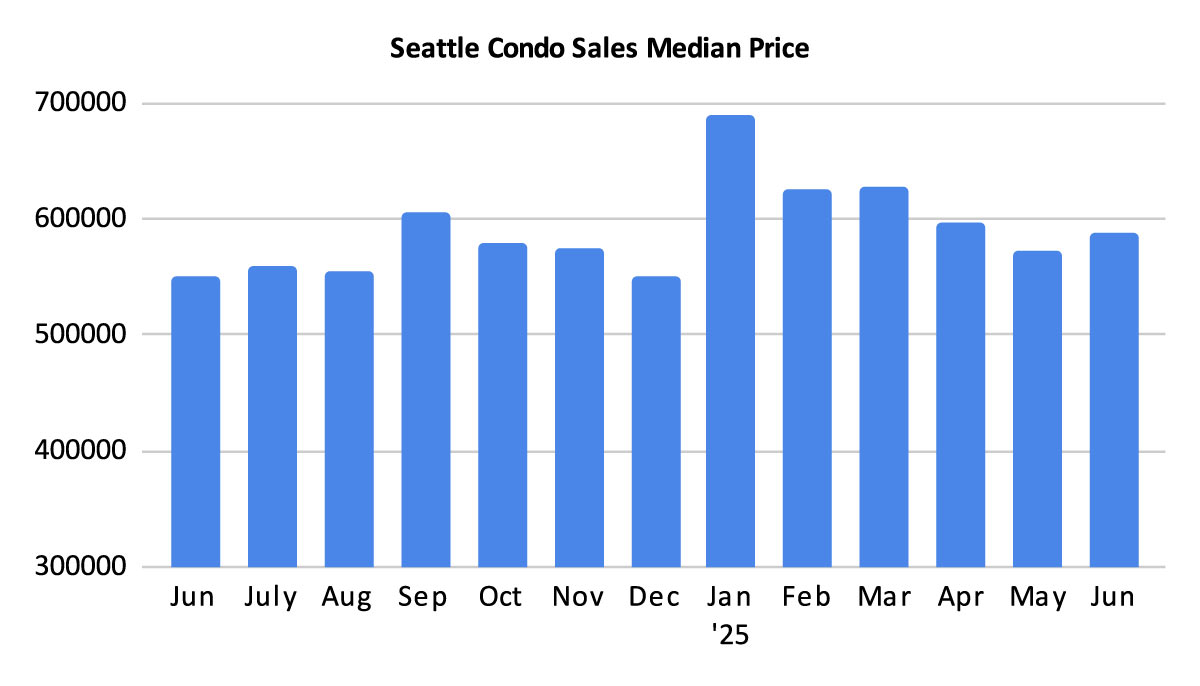
Condo Selling Prices Rebound
The Seattle citywide condo median sales price in June came in at $589,000. That reflected a year-over-year increase of 7.1% and a month-over-month improvement of 2.7%. By NWMLS neighborhood area, Northeast Seattle (+54.4%), Capitol Hill (+11.7%) and Queen Anne / Magnolia (+8.5%) led the way. On the other end, Southeast Seattle (-8.6%) and West Seattle (-6.5%) registered a drop in their median selling prices. View complete statistical information at the end of the post here.
These median sale price numbers represent all condominium sales reflected in the NWMLS database. However, the NWMLS has a broad definition of “Condominium”, which includes the typical, tradition units in multi-unit buildings or complexes. In addition, it encompasses non-traditional property types such as townhomes, condo-ised single family houses, accessory dwelling units (ADU), detached accessory dwelling units (DADUs), boat moorage and parking spaces.
Non-traditional condo properties comprised 21.4% of all sales in June with a median sales price of $799,000. If we exclude these, then the median sales price of traditional condo units was $512,000 last month. Compared to last June, the median sales prices of traditional Seattle condos increased 6.7%. And compared to the prior month, it rose 9.8%.
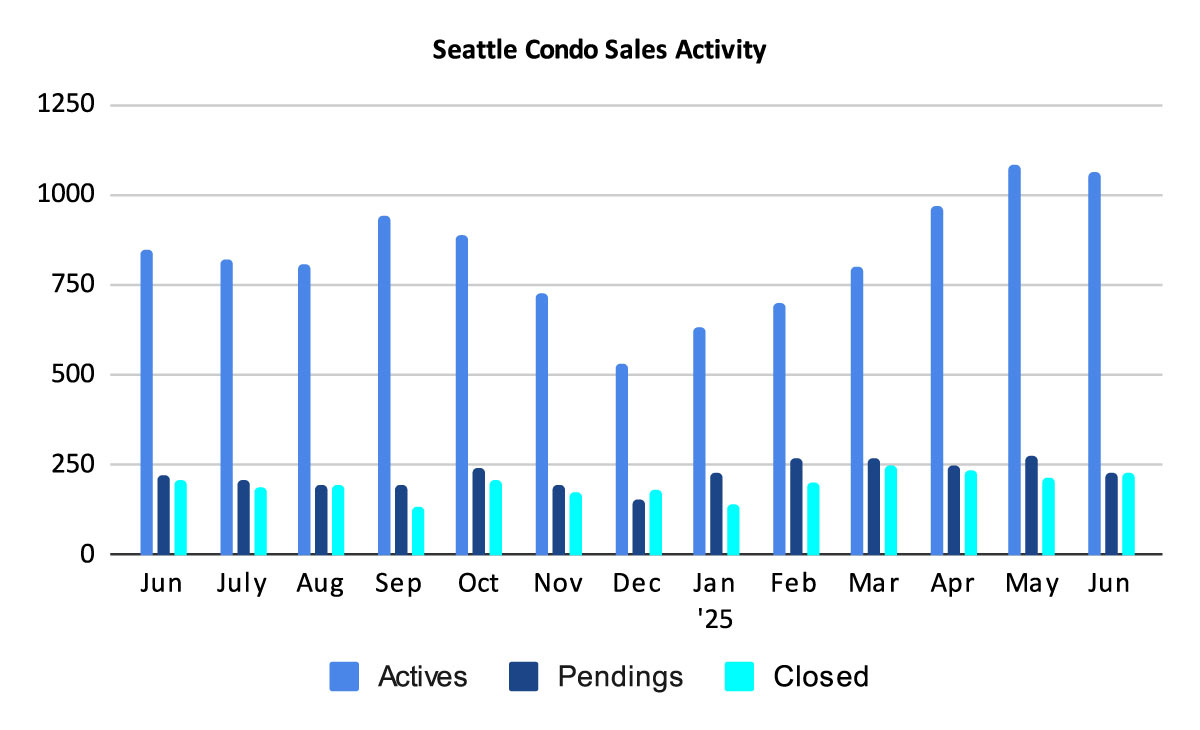
Sellers Take a Breather
The number of active listings for sales dipped slightly in June to 1,064 at month end. That’s down 1.8% from the prior month, but 25.6% more than the same period last year.
New listings coming to market also slowed. We started June with 1,083 listing and sellers added 448 new listings during the month for a total of 1,531. The 448 new listings was 18.2% fewer than the previous month, though that was 7.2% more year-over-year.
Of the 1,531 listings in June, 467 came off the market (e.g. pending/under contract, rented out, expired, cancelled or were temporarily taken off the market) leaving 1,064.
Two notes about the number of active listings. First, this only accounts for listings entered into the NWMLS database. There are quite a few properties in recently completed buildings that are available but not publicly listed for sale in the NWMLS. Thus, the actual number of listings is higher.
Second, non-traditional properties account for 19.9% of the currently inventory. One out of every five condos listed for sale is either a townhome, ADU, DADU or a condo-ised single family house.
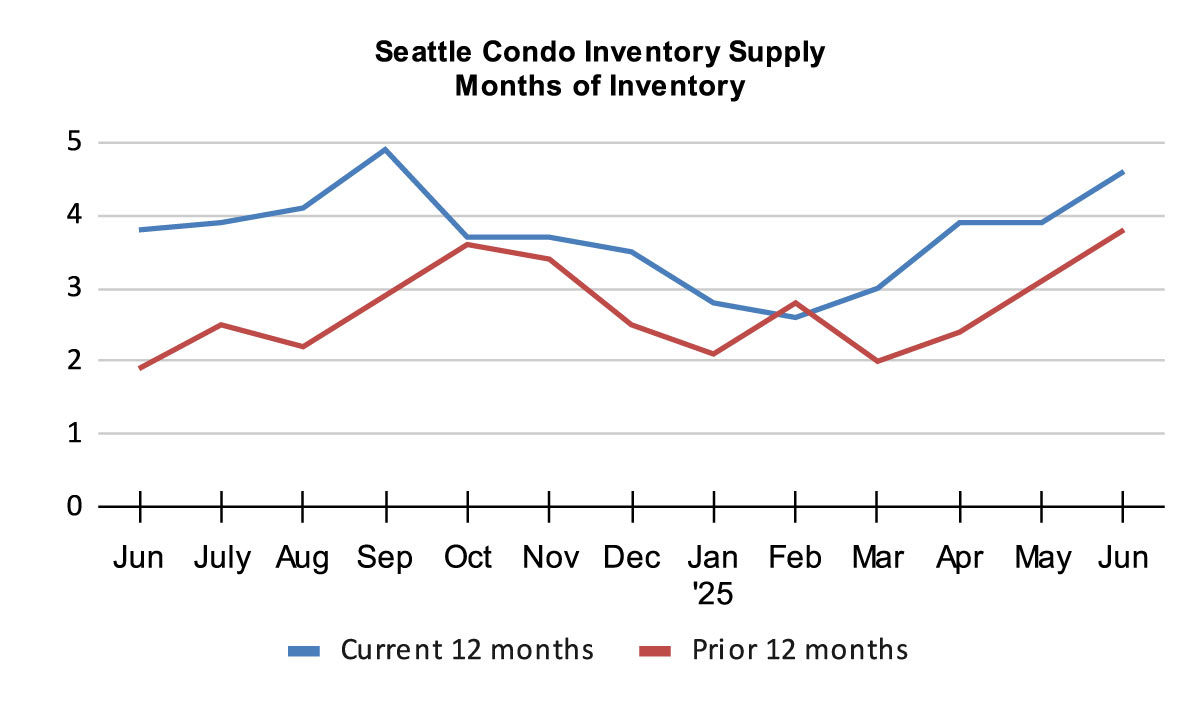
Even though listings decreased, the inventory supply rate rose to 4.6-months of supply. That places Seattle firmly in a balanced or normal market. The increase was due to a drop in pending sales.
The inventory supply rate is a metric utilized to define the current real estate market environment. A supply rate less than 4-months is categorized as a seller’s market. A rate between 4-months to 7-months is a balanced / normal market place. And, a rate more than 7-months is characterized as a buyer’s market.
Buyers and sellers will encounter varying experiences based on neighborhood and price points. For example, West Seattle, Northwest Seattle and Southeast Seattle exhibited seller market conditions last month – they had supply rates less than 3-months. Downtown Seattle / Belltown had an 8.5-month supply rate in June, a definitive buyer’s market.
Sales Outpace 2024
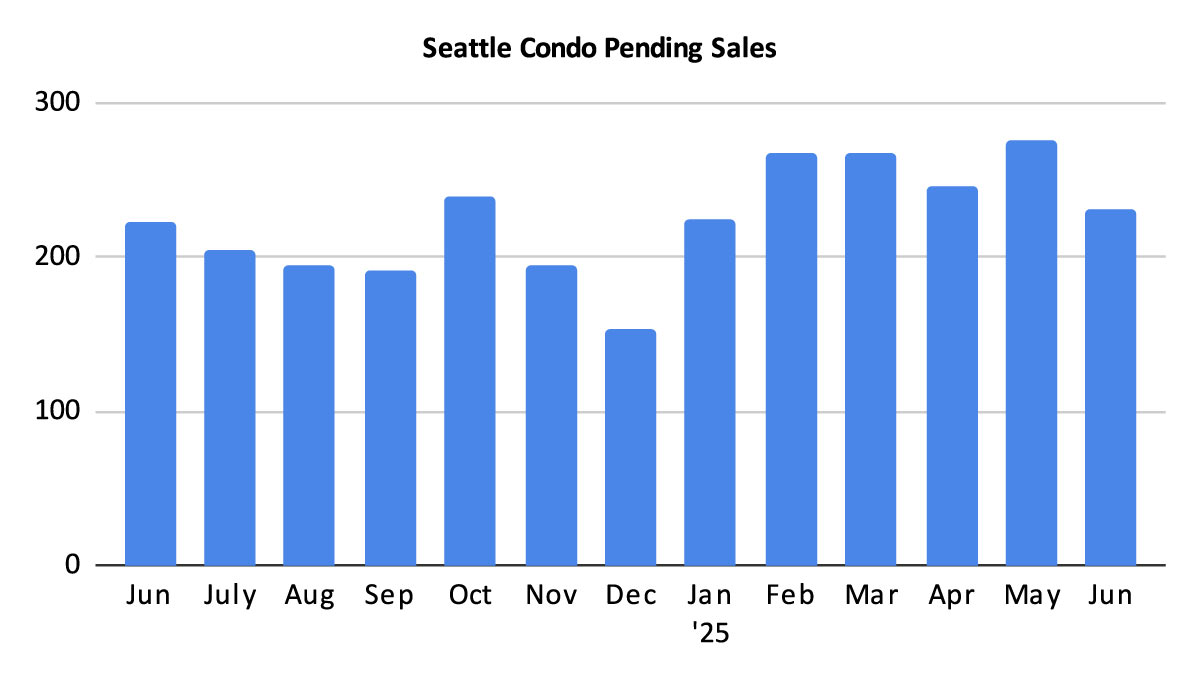
There were 231 pending sales transactions (listings under contract in escrow) in June. That was a dip of 16% from the prior month, but outpaced last June by 3.6%. Buyers have lots of choices and purchasing/negotiating power yet seem to be sitting on the fence. Uncertainty with the job market, mortgage interest rates and even summer related activities have given buyers pause.
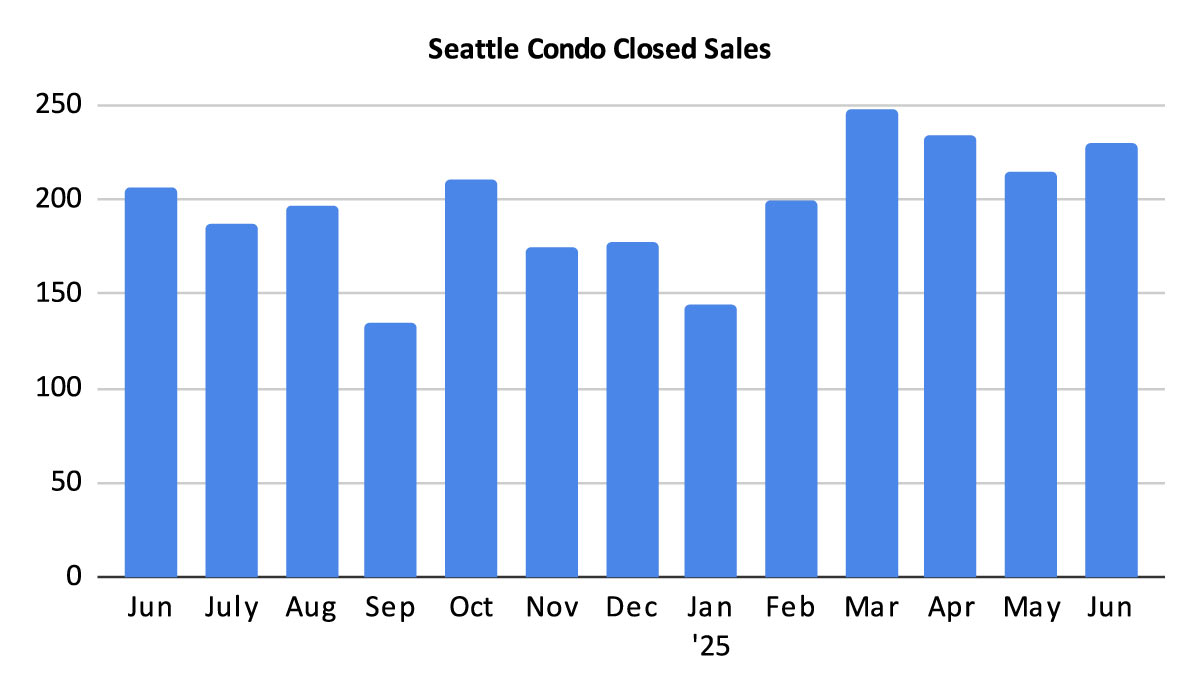
The number of closed sales increased in June, which was expected given the higher sales activity in May. There were 230 closed units reflecting a one-year and one-month increase of 11.1% and 7%, respectively.
In Summary
Summer provided a little surprise for Seattle’s sluggish condo market. Inventory dipped as median selling prices rose. Condo unit sales improved compared to the same period last year, but dropped from the prior month. Though, Seattle’s real estate market is cyclical and we do see sales start to trend down as we hit the half year point.
The Summer sunshine and recreational activities tend to compete with house hunting. That, and the uncertainty with the economy and job market, as well as mortgage interest rates, may have also sidelined buyers. But, even though mortgage interest rates are high buyers have the option to refinance once rates dip.
That said, the softening market place provide Seattle condo buyers the upper hand. Buyers have more negotiating power with condos sitting on the market longer and sellers being more open to compromise.
For Seattle condo sellers, the second half of the year is generally less advantageous, yet buyers are still buying as noted with sales outpacing last year’s activity. A well-priced property in certain neighborhoods sell quickly.
Seattle Condo Market Statistics June 2025
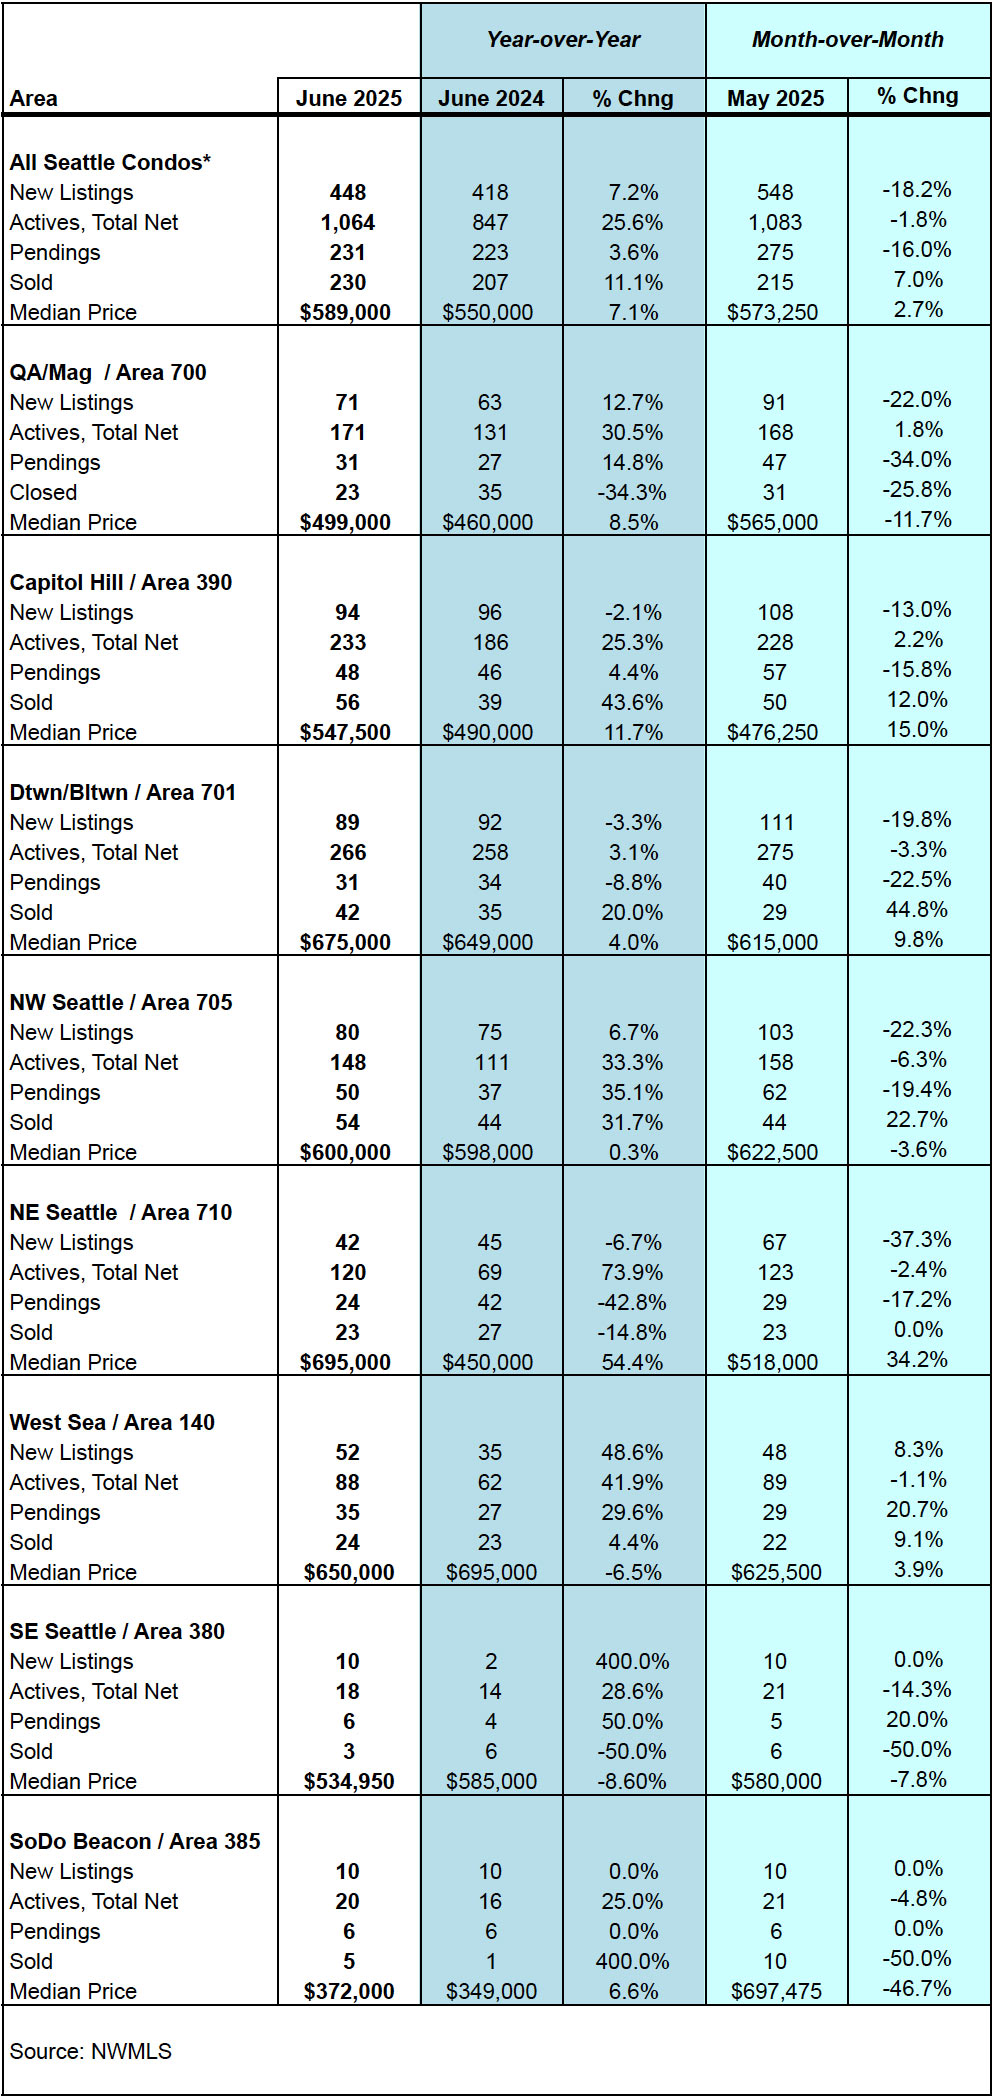
Source: Northwest Multiple Listing Service. Some figures were independently compiled by Seattle Condos And Lofts and were not published by the NWMLS.
© SeattleCondosAndLofts.com