Seattle Condo Recap January 2025

Seattle’s condominium market started 2025 off with a blast. After a sluggish 2024, January’s condo figures exhibited a marked improvement in selling prices and sales activity.
Record Breaking Selling Prices
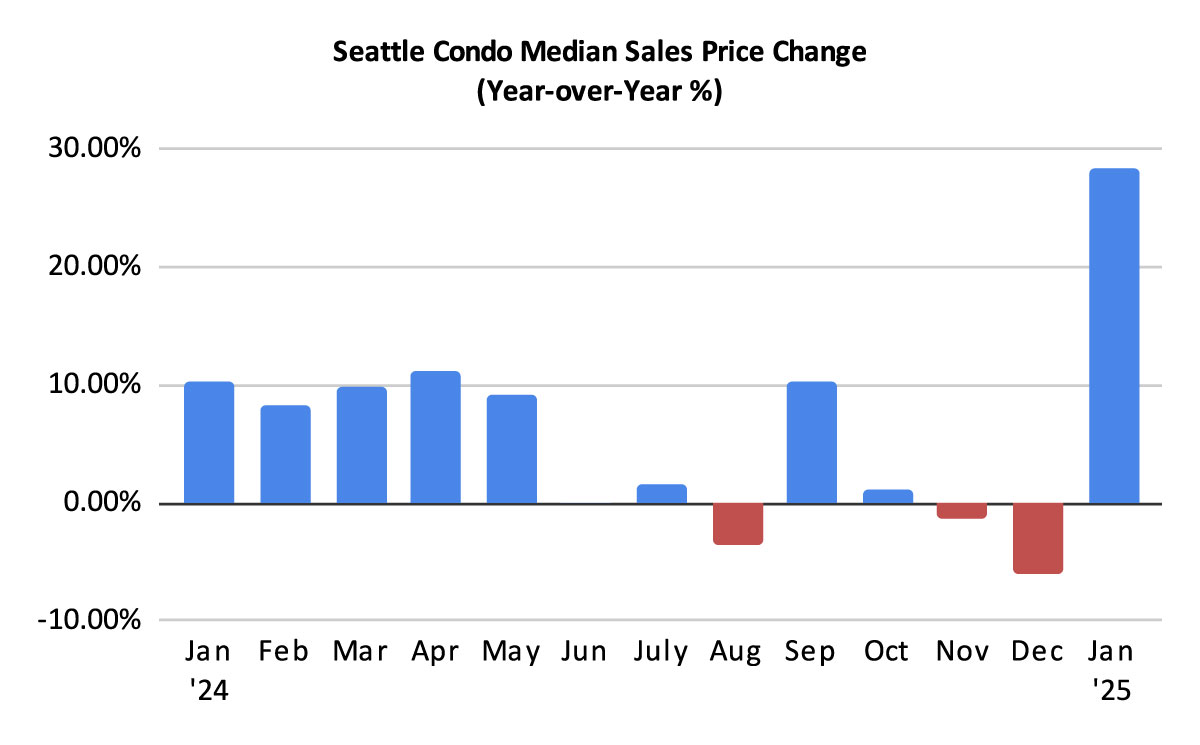
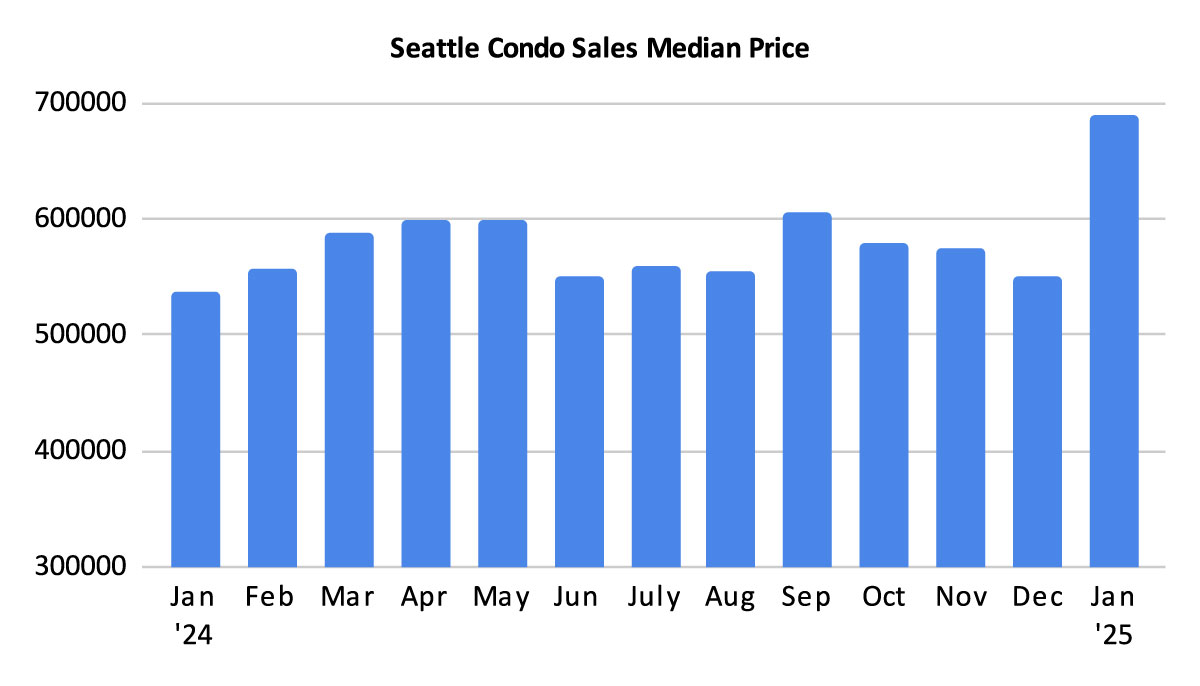
The Seattle condo market clocked in a new all-time record high citywide median sales price of $689,975. That’s a whopping 28.4% year-over-year, and a 25.5% one-month increase, respectively. Granted, it’s just the result of a single month and not a trend or a market turnaround. Nevertheless, it’s a positive way to start the new year.
By NWMLS neighborhood areas Queen Anne / Magnolia (+50.5%), Northwest Seattle (+31.8%), Downtown (+19.2%) and West Seattle (+16.8%) lead the way with double digit increases of their median selling prices. Capitol Hill (-6.9%), South and Southeast (-6.1% & -8.5%) reflected decreases. See full neighborhood area results here.
However, there are two factors to take into consideration when looking at this statistic. First, the quality of properties sold in January 2025 compared to January 2024, and second, the type of properties sold.
In 2024, 61% of the condos sold were priced at or above $500,000 compared to 69% in 2025. With a greater number of higher valued properties selling in January 2025 the mid-point shifted, which contributed to the rise of the median selling price.
But, more importantly are the type of properties. The NWMLS expanded the definition of “condominium” a couple of years ago. In addition to the typical unit in a multi-unit building or complex, the condominium category now includes condoized single family houses, townhomes, accessory dwelling units (ADUs), detached accessory dwelling units (DADUs), floating homes and moorage.
These non-traditional condo properties comprised 36.4% of the condos sold in January 2025. That’s 1 in every 3 properties. Back in January 2024 they made up 27.7% of the properties sold. These types of properties are usually newer and more expensive than the typical condo unit, thus their higher values and greater numbers sold significantly affected median selling prices.
If we were to compare only traditional condo units, the Seattle citywide median sale would have increased only 5.5% year-over-year ($511,000 in January 2025 vs $484,500 in January 2024). A far more modest change compared to 28.4% when we include non-traditional condo properties.
Since Queen Anne / Magnolia had the highest year-over-year jump in its median sales price of 50.5%, I wanted to break that down further. In looking at all condo properties (traditional and non-traditional), 69.5% of those sold in January 2025 were over $500,000 compared to only 45% in January 2024.
All of the properties that sold in January 2024 were traditional condos compared to 70% in 2025. The 30% non-traditional condos that sold in January 2025 had an average selling price of $1,077,000. If we exclude these and look at just traditional condos then Queen Anne’s median sales price would have risen 13.4% year-over-year instead of 50.5%.
Listings Galore
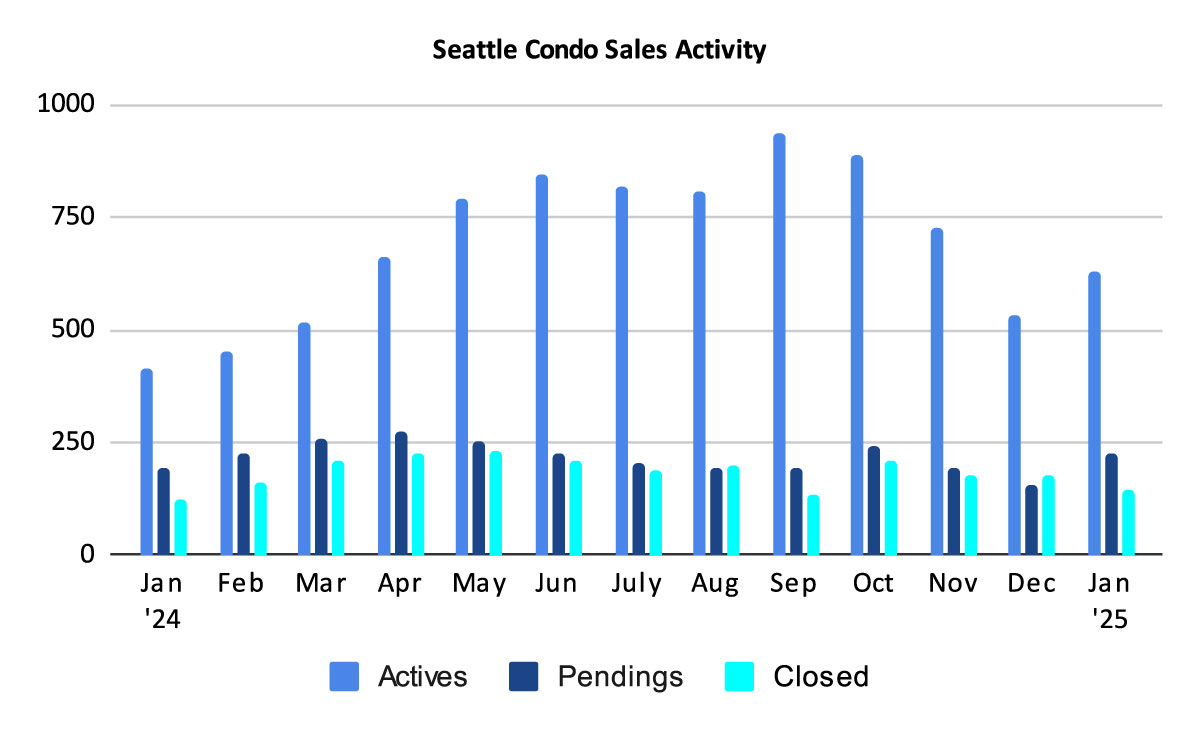
As we would expect coming out of the year-end holiday season and the start of a new year, the number of Seattle condo listings for sale was on the upswing in January.
We started the month with 531 condo listings and sellers added 394 new listings in January for a total of 925 units. Of those, 296 came off the market (e.g. pending status, sold, expired, canceled, rented), leaving 629 listings for sale at month’s end.
That represented an increase of 51.9% over January of last year and 18.5% more than we had in December 2024.
Sellers also added more new listings in January by 47% compared to the same period last year (394 vs 268).
As of this writing, non-traditional condo properties comprise 23.9% of the active condo listings.
Even though the number of condo listings jumped last month, the inventory supply rate dropped as a result of strong condo sales to 2.8-months of supply. This tracks similarly with the previous year.
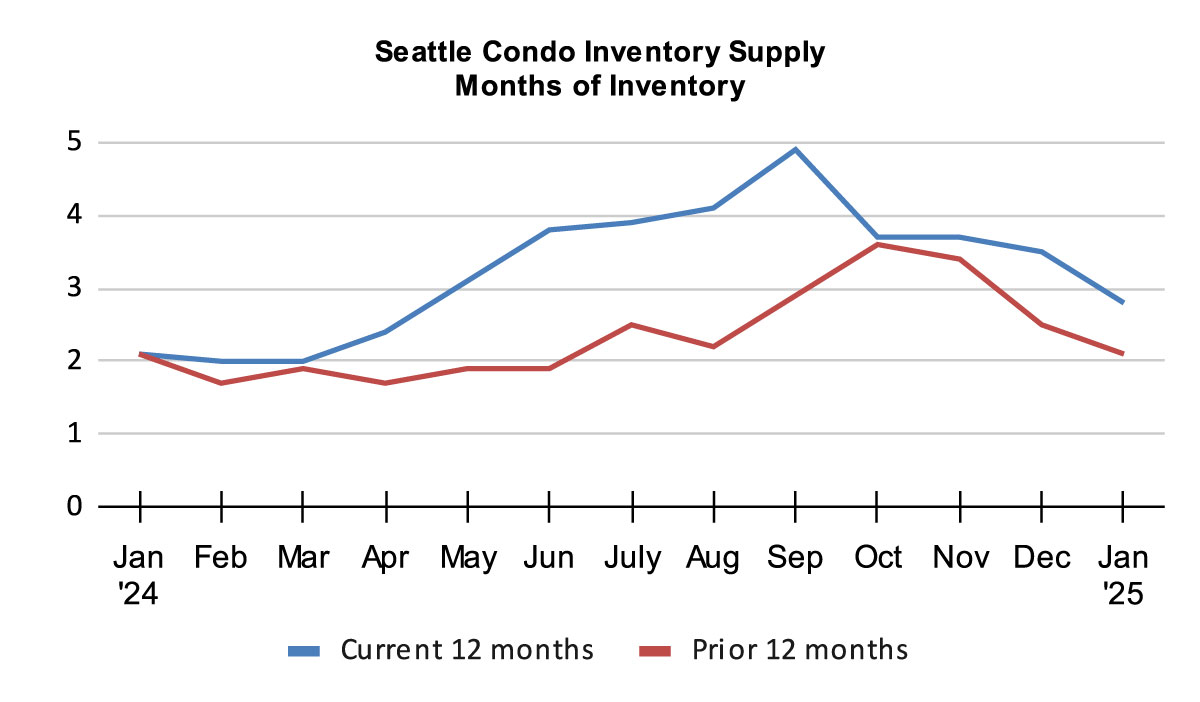
The inventory supply rate is a metric that classifies the current state of the real estate market. A rate of less than 4-months of supply is characterized as a seller’s market. A rate between 4 to 7-months is a balanced or normal market. And, a rate over 7-months is considered a buyer’s market.
This reflects Seattle as a whole. However, Seattle is comprised of micro-markets, thus buyers and sellers will encounter differing market conditions based on neighborhood locale and price point.
Buyers will have more favorable terms in condo dense areas like downtown or Capitol Hill, as well as in the south end. Conversely, they may likely encounter tighter market conditions in North and West Seattle.
The supply can also be expressed by the absorption rate which was 35.8% last month.
Buyers on the Hunt
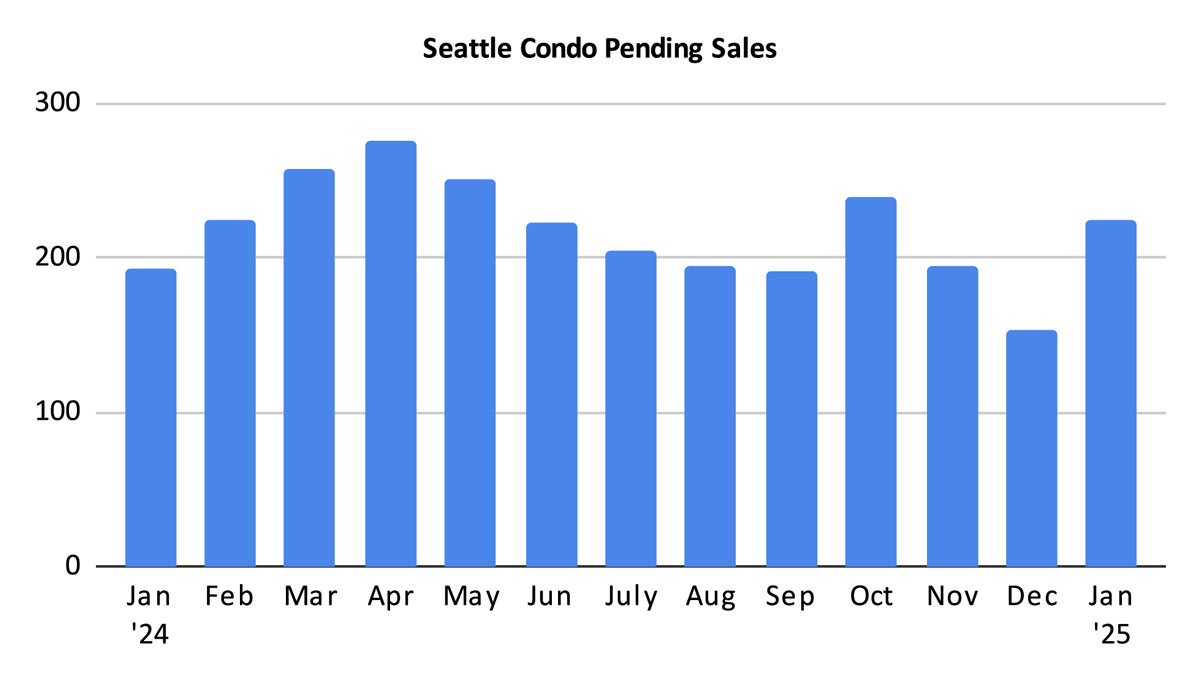
External factors aside, buyers were keen on the condo market and itching to purchase, at least locally. Buyers swooped up condos with 225 units going under contract into pending status in January. That reflected a 16.6% increase over last January and a 47.1% increase in sales over December.
With our cyclical seasonal market, I anticipate sales will continue raise as we progress into to spring.
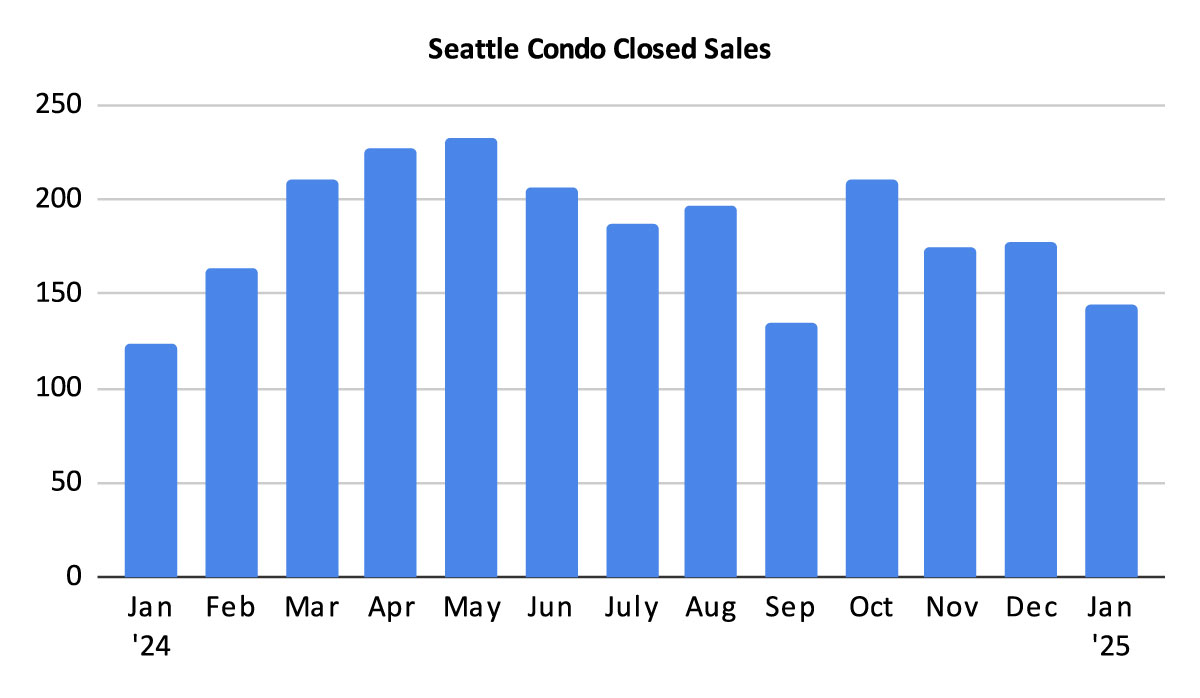
The number of closed condo sales also improved in January with 144 closings, a 16.1% increase year-over-year. However, closings dropped 19.1% compared to December.
In Summary…
Seattle’s condo market shrugged off its winter doldrums and started 2025 off strong with a new all-time record high median selling price and robust sales activity.
Listings came on the market fast and furious, though current sales velocity have kept the inventory supply rate low overall.
Buyers will benefit from increasing condo supply and more options. Though, depending on their desired neighborhood and price point they may find themselves in a competitive market place, especially for entry level properties. Conversely, for higher priced units in condo dense neighborhoods where sales are lagging, they may find deals to be had.
Sellers generally will encounter a strong market overall. We’re now in our 13th year of being in a sellers market (citywide). But, the condo market is considerably softer than for single family homes and townhomes. Again, however, location and price points will affect sellers’ experiences and outcome. In some areas, sellers may encounter a buyers market environment.
Thinking of buying or selling a condo this year? Drop us a line and let us get you started on your way.
Seattle Condo Market Statistics January 2025
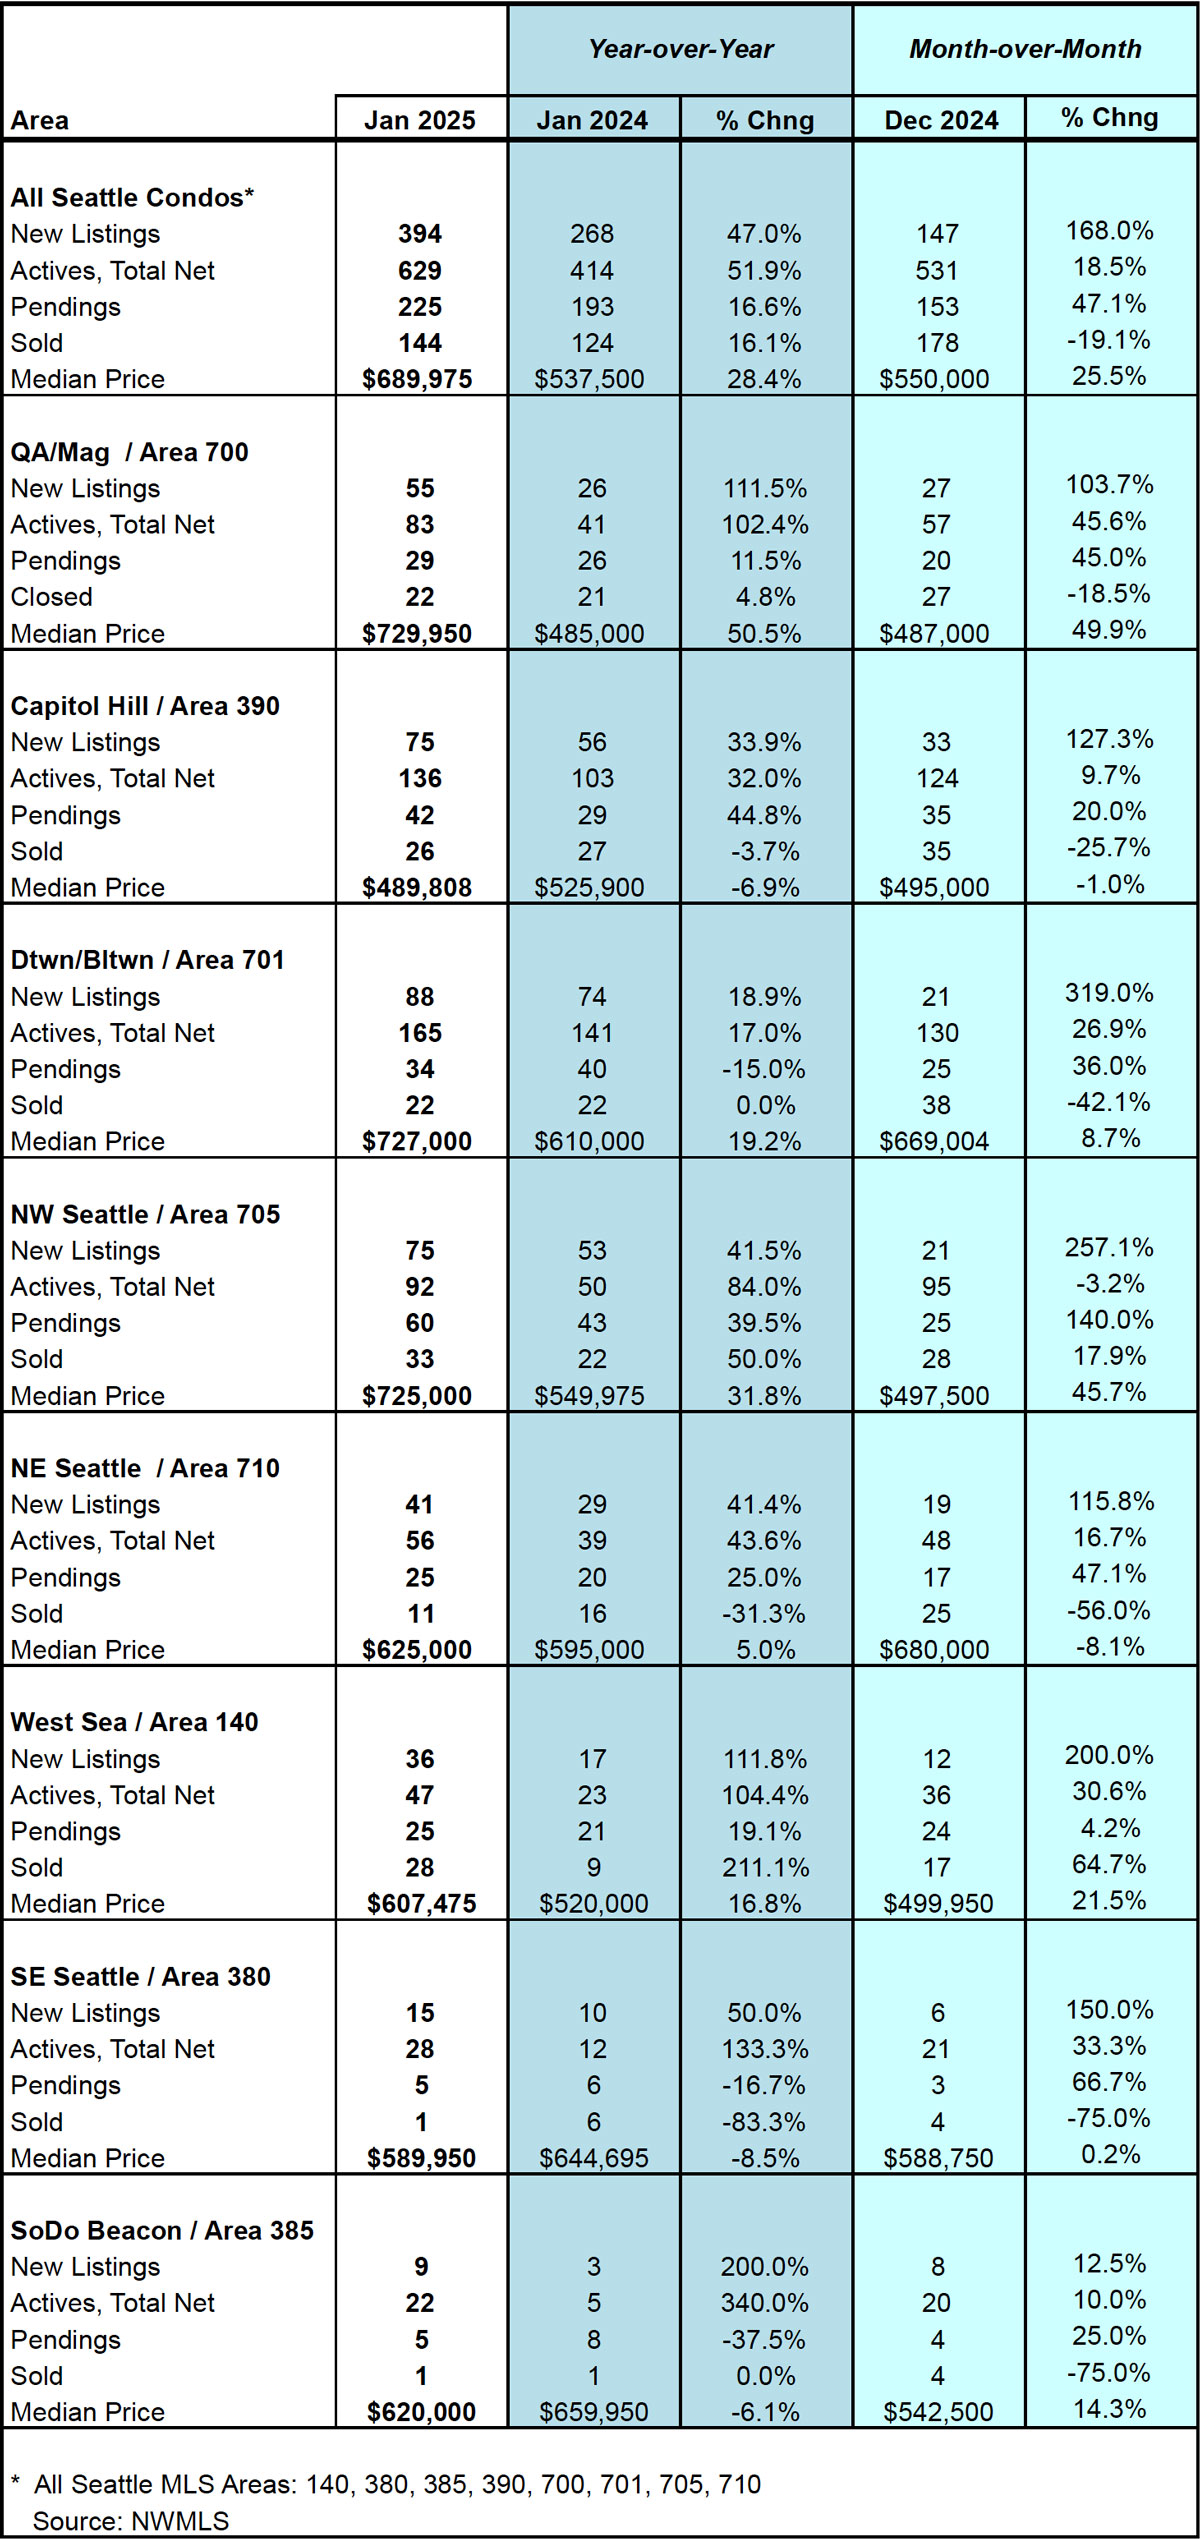
Source: Northwest Multiple Listing Service. Some figures were independently compiled by Seattle Condos And Lofts and were not published by the NWMLS.
© SeattleCondosAndLofts.com