Seattle Condo Review February 2025
February reflected another solid month for Seattle’s condominium market. Buyers and sellers experienced an active marketplace with increased listing options, more sales activity and higher prices.
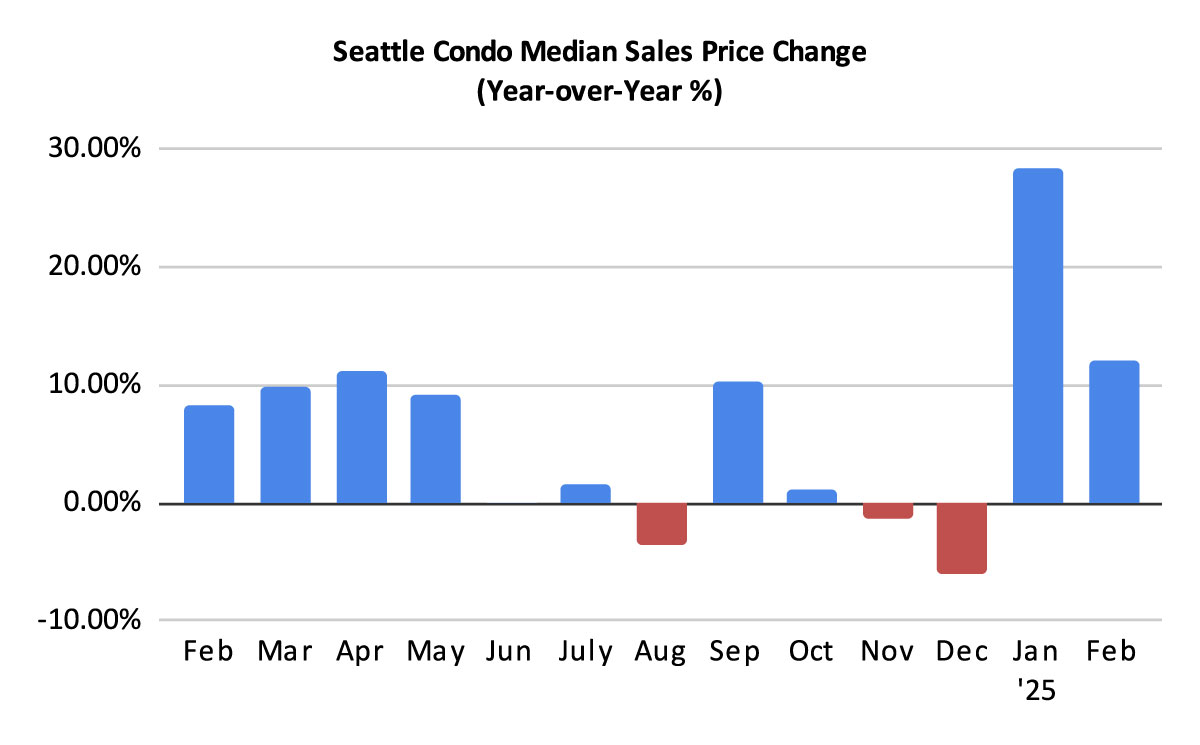
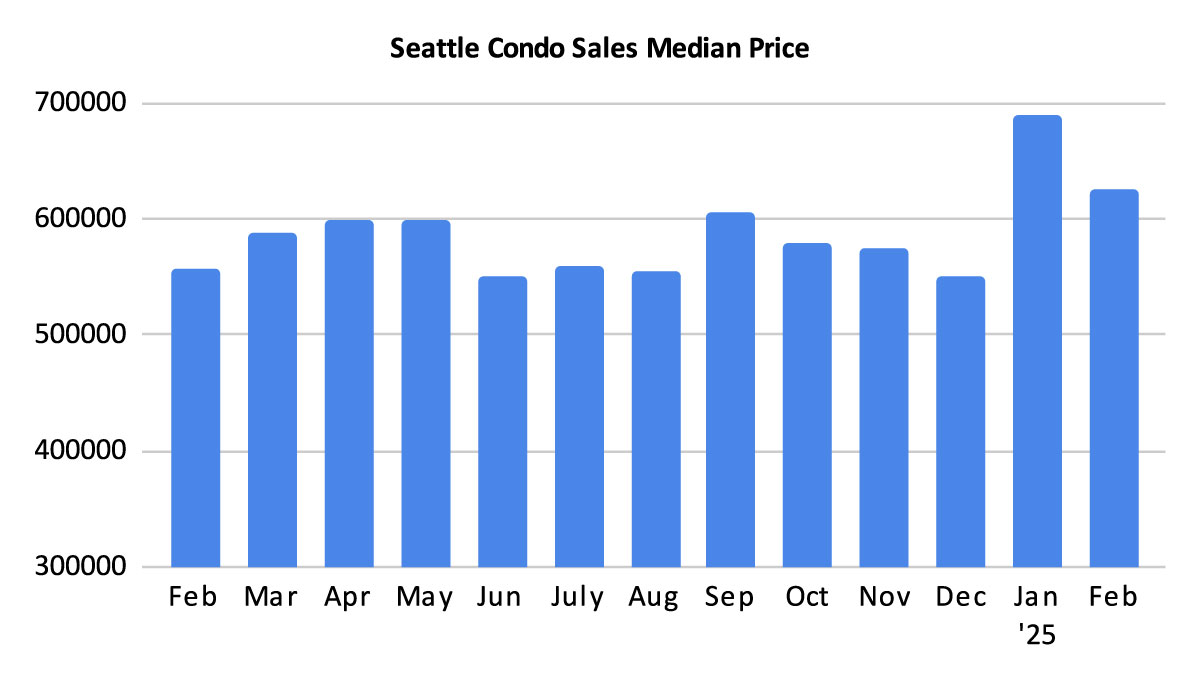
Selling Prices Rise
The Seattle citywide median sales price for condos in February rose 12% year-over-year to $625,000. That was a 9.4% drop from the prior month, though January’s record high was an anomaly fueled by sales of townhomes. At $625,000, February’s median sales price was the second highest on record.
By NWMLS neighborhood areas, Queen Anne / Magnolia (+55%), Northeast Seattle (+31%), Southeast Seattle (+24.1%), West Seattle (+12.6%) and Northwest Seattle (+10.6%) all reflected year-over-year gains in their median selling prices for the month. On the other hand, South Seattle (-20.5%), Capitol Hill / Central (-6.2%) and Downtown / Belltown (-4.5%) saw a decrease in their median selling prices. See full neighborhood area breakdown stats here.
It is important to note that the higher median selling prices we’re experiencing are significantly impacted by the sales of townhomes and other non-traditional condo properties.
For clarification, by traditional condos I’m referring to an individual condo unit (e.g. studio, 1-bedroom, 2-bedroom, 3-bedroom) in a multi-unit building or complex. By non-traditional condos, I’m referring to townhome developments, single family dwellings that have been condoized, accessory dwelling units (ADU), detached accessory dwelling units (DADU) and boat moorage. These are typically newer and more expensive than a traditional condo unit and drive the monthly selling price stats up.
In February, non-traditional condo properties made up 30.3% of all condo sales in Seattle with a median selling price of $775,000.
If we exclude these and just look at traditional condo units, the median selling price would be $490,000. That’s a considerable difference from $625,000. What’s more striking is the median selling price of traditional condos in February 2024 was $508,500, therefore, we actually had a year-over-year decrease of 3.6%.
I’d like to highlight one neighborhood area as an example – Northeast Seattle. This is NWMLS area 710 and runs north of the ship canal up to NE 145th St, and east of I-5. The 24 sales in February had a median selling price of $655,000 exhibiting a 31% year-over-year increase. However, half of those sales were townhomes or a condoized single family dwelling, which had a median selling price of $869,500. Conversely, traditional condo units had a median selling price of $400,000.
The inclusion of townhomes, single family dwellings, ADUs and DADUs substantially skew Seattle condo statistics.
More Listing Options for Buyers
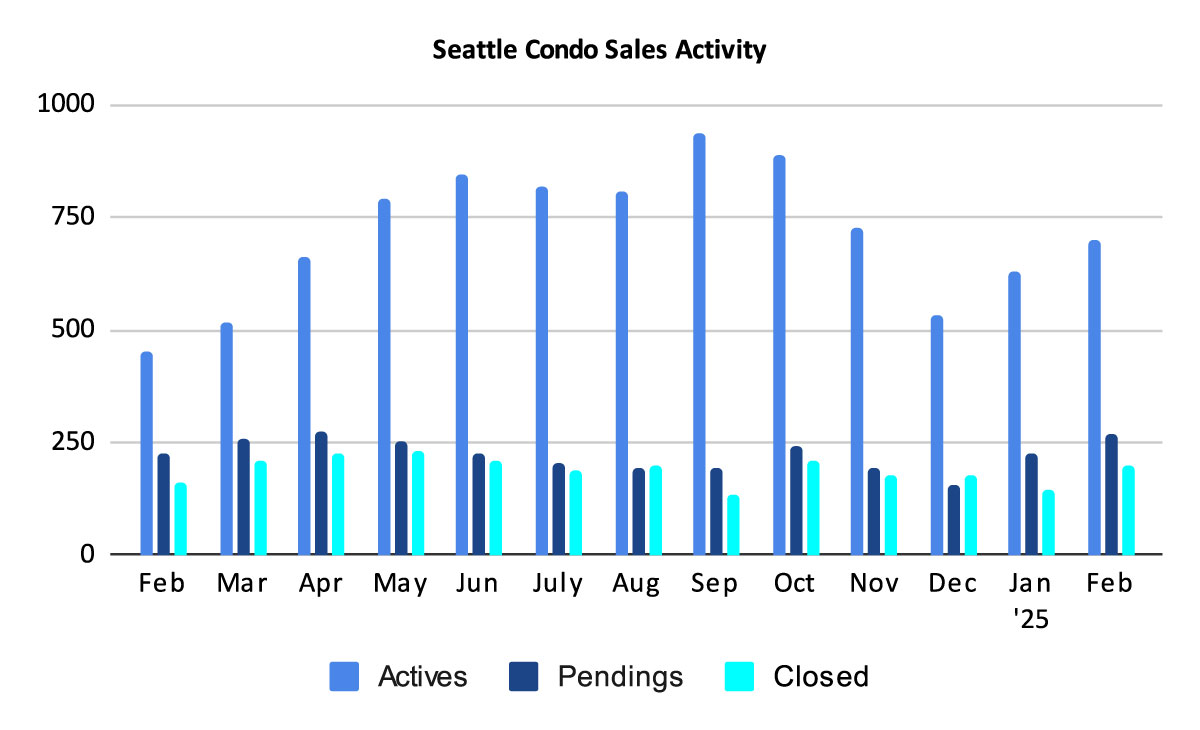
As we expect with the start of the new year, the number of condo listings have increased. Seattle ended February with 699 active condo listings for sale, reflecting a one-year and one-month increase of 55% and 11.1%, respectively.
While we ended the month with more listings overall, sellers brought 3.6% fewer new listings to market in February than in January. Perhaps being a shorter month may have accounted for that, or sellers are holding off until Spring.
We started February with 629 listings and sellers added another 380 listings during the month for a total of 1,009 units for sale. Of that number, 310 units came off the market due to sales, cancellations, expirations, being rented out, temporarily off market or other reasons, leaving 699 at month end.
The inventory supply rate in February decreased slightly to 2.6-months of supply based on pending sales transactions. The supply rate represents the value in time that the market will exhaust the current inventory if no new listings are brought to market. That is, at the current rate of sales, with no new listings, Seattle will exhaust its condo listing supply in 2.6 months.
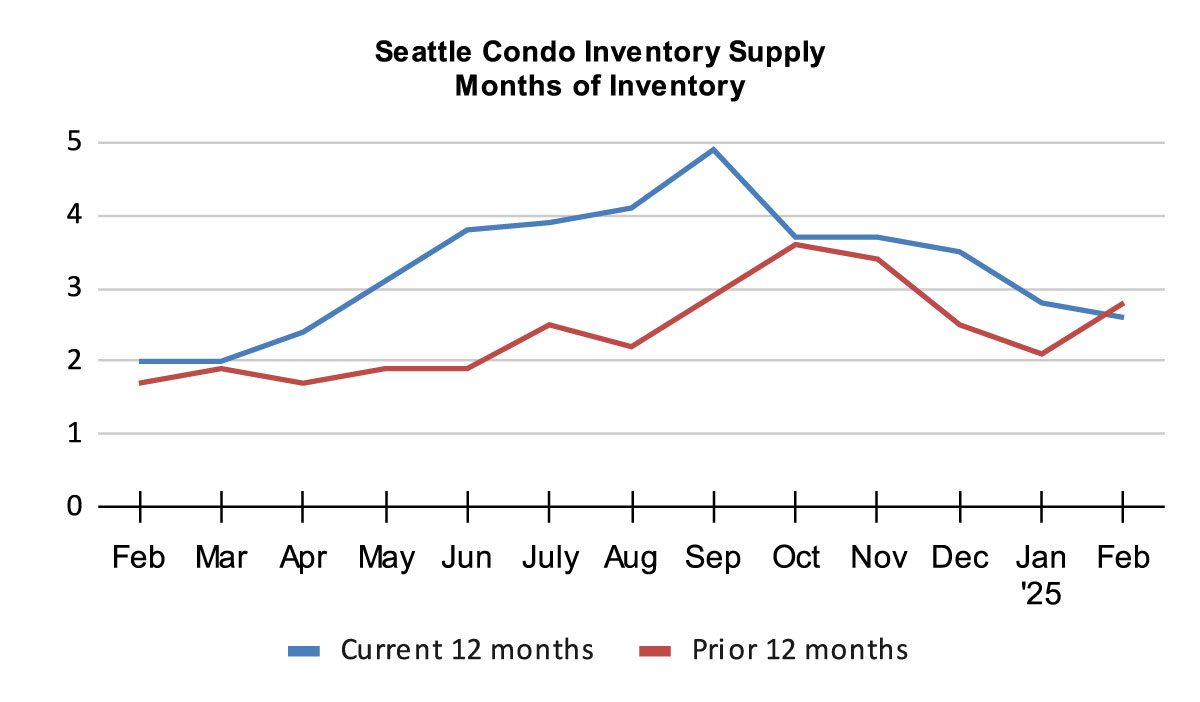
The inventory supply rate is a metric utilized to characterize the housing market environment. A rate of less than 4-months of supply is considered a seller’s market. A rate between 4 to 7-months is a normal or balanced market. While a rate greater than 7-months of supply would be a buyer’s market.
Except for 3 months over the past 13 years, Seattle (citywide) has technically been in a seller’s market since February 2012 based on the inventory supply rate.
With that said, buyers and sellers will experience different market conditions based on Seattle’s neighborhood micro-markets and price points. Condo dense areas like downtown, Belltown and Capitol Hill will have a softer market that is more favorable to buyers. While in North Seattle, the market will be more balanced or even exhibiting seller market conditions.
Lower priced properties appeal to a larger buyer pool and can be more competitive compared to high-end luxury units.
As of this writing, 23.4% of current condo listings are non-traditional condos. And, in some areas like Northwest Seattle (NWMLS are 705 – West of I-5, north of the ship canal), presently 54% of the 99 current listings are non-traditional condos.
Seattle Condo Sales Trend Upwards
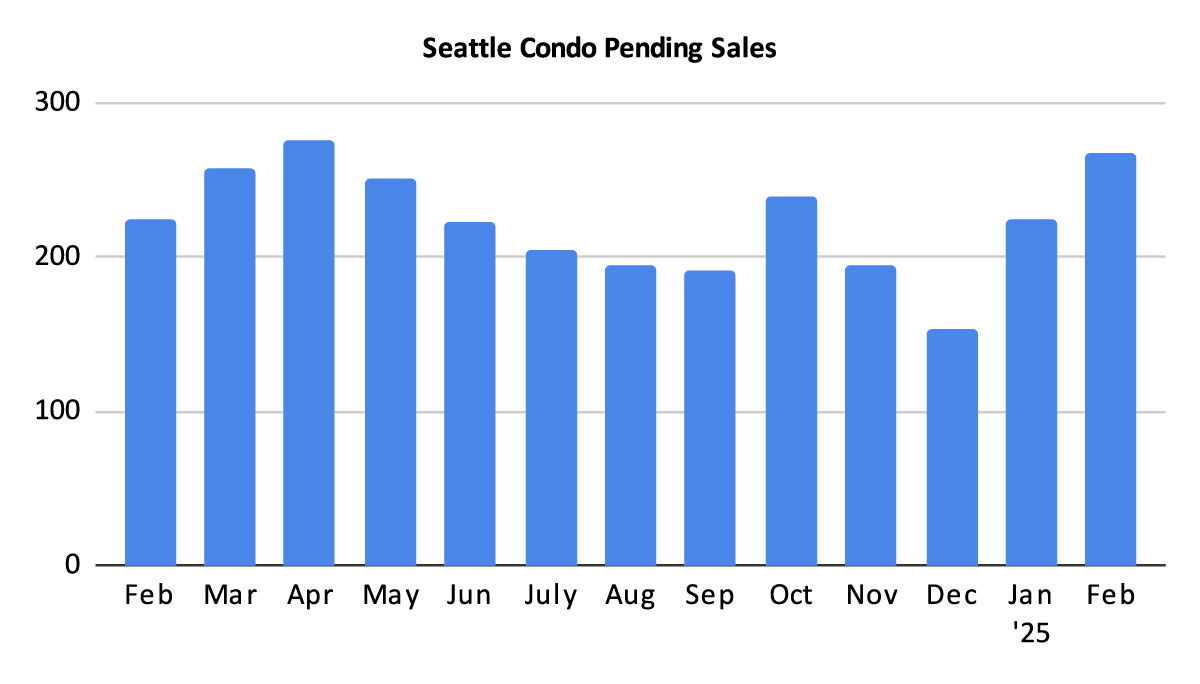
There were 267 pending sales transactions (listings under contract in escrow) last month. That reflected a year-over-year, and a one-month, improvement of 18.7% for both. This is expected as Seattle’s real estate market is cyclical and we anticipate property sales to increase throughout the spring season.
Regardless of external turmoil in the financial markets, the employment sector, mortgage interest rates and other factors, buyers have shown confidence in the local market and investing in real estate.
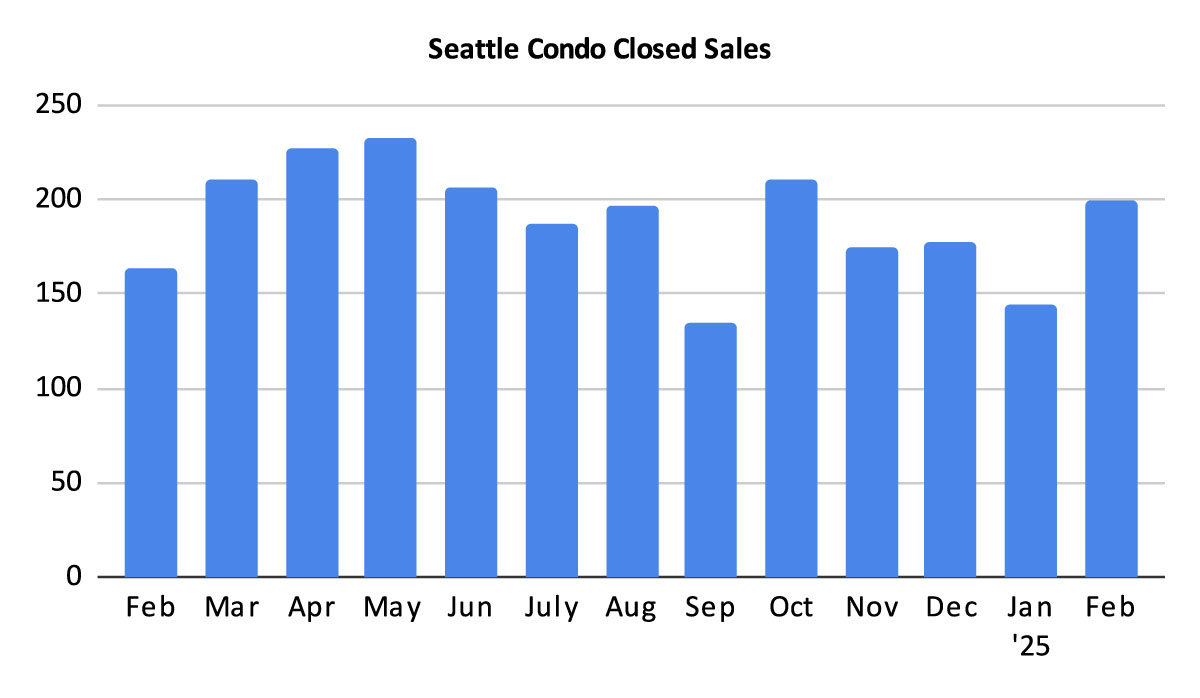
There were 199 closed Seattle condo transactions in February, up 22.1% over last February and 38.2% over the prior month. Closings follow pendings by around 30-days, so this should increase as long as pending sales rise.
In Summary…
February was a stellar month of Seattle’s condo market with more listings, strong sales velocity and higher prices. The citywide median sales price of $625,000 was the second highest on record. Although that was less than the prior month, January was an anomaly.
Sales were mostly driven by non-traditional condo properties such as townhomes, which are typically newer and with higher prices. Excluding non-traditional condos then the citywide median sales price for the typical condo unit would have been $490,000. And, that would have reflected a 3.6% decreased compared to last February (traditional condo properties).
Condo sales increased and we anticipate more sales activity as we navigate through Seattle’s prime spring real estate market.
Condo buyers can except more listing options as supply should increase through to summer. In condo dense areas like Capitol Hill and downtown, they may find a more favorable softer market conditions. On the other hand, buyers may experience tighter conditions in the North end and West Seattle.
And, for condo sellers, the opposite is somewhat true. Sellers in downtown and Capitol Hill may experience a slightly longer time on market with fluctuating prices, while those in the North end may experience better results.
Whether 2025 is the year to buy your new home or sell your condo, we can help. Drop us a line and let us get you started on your way.
Seattle Condo Market Statistics February 2025
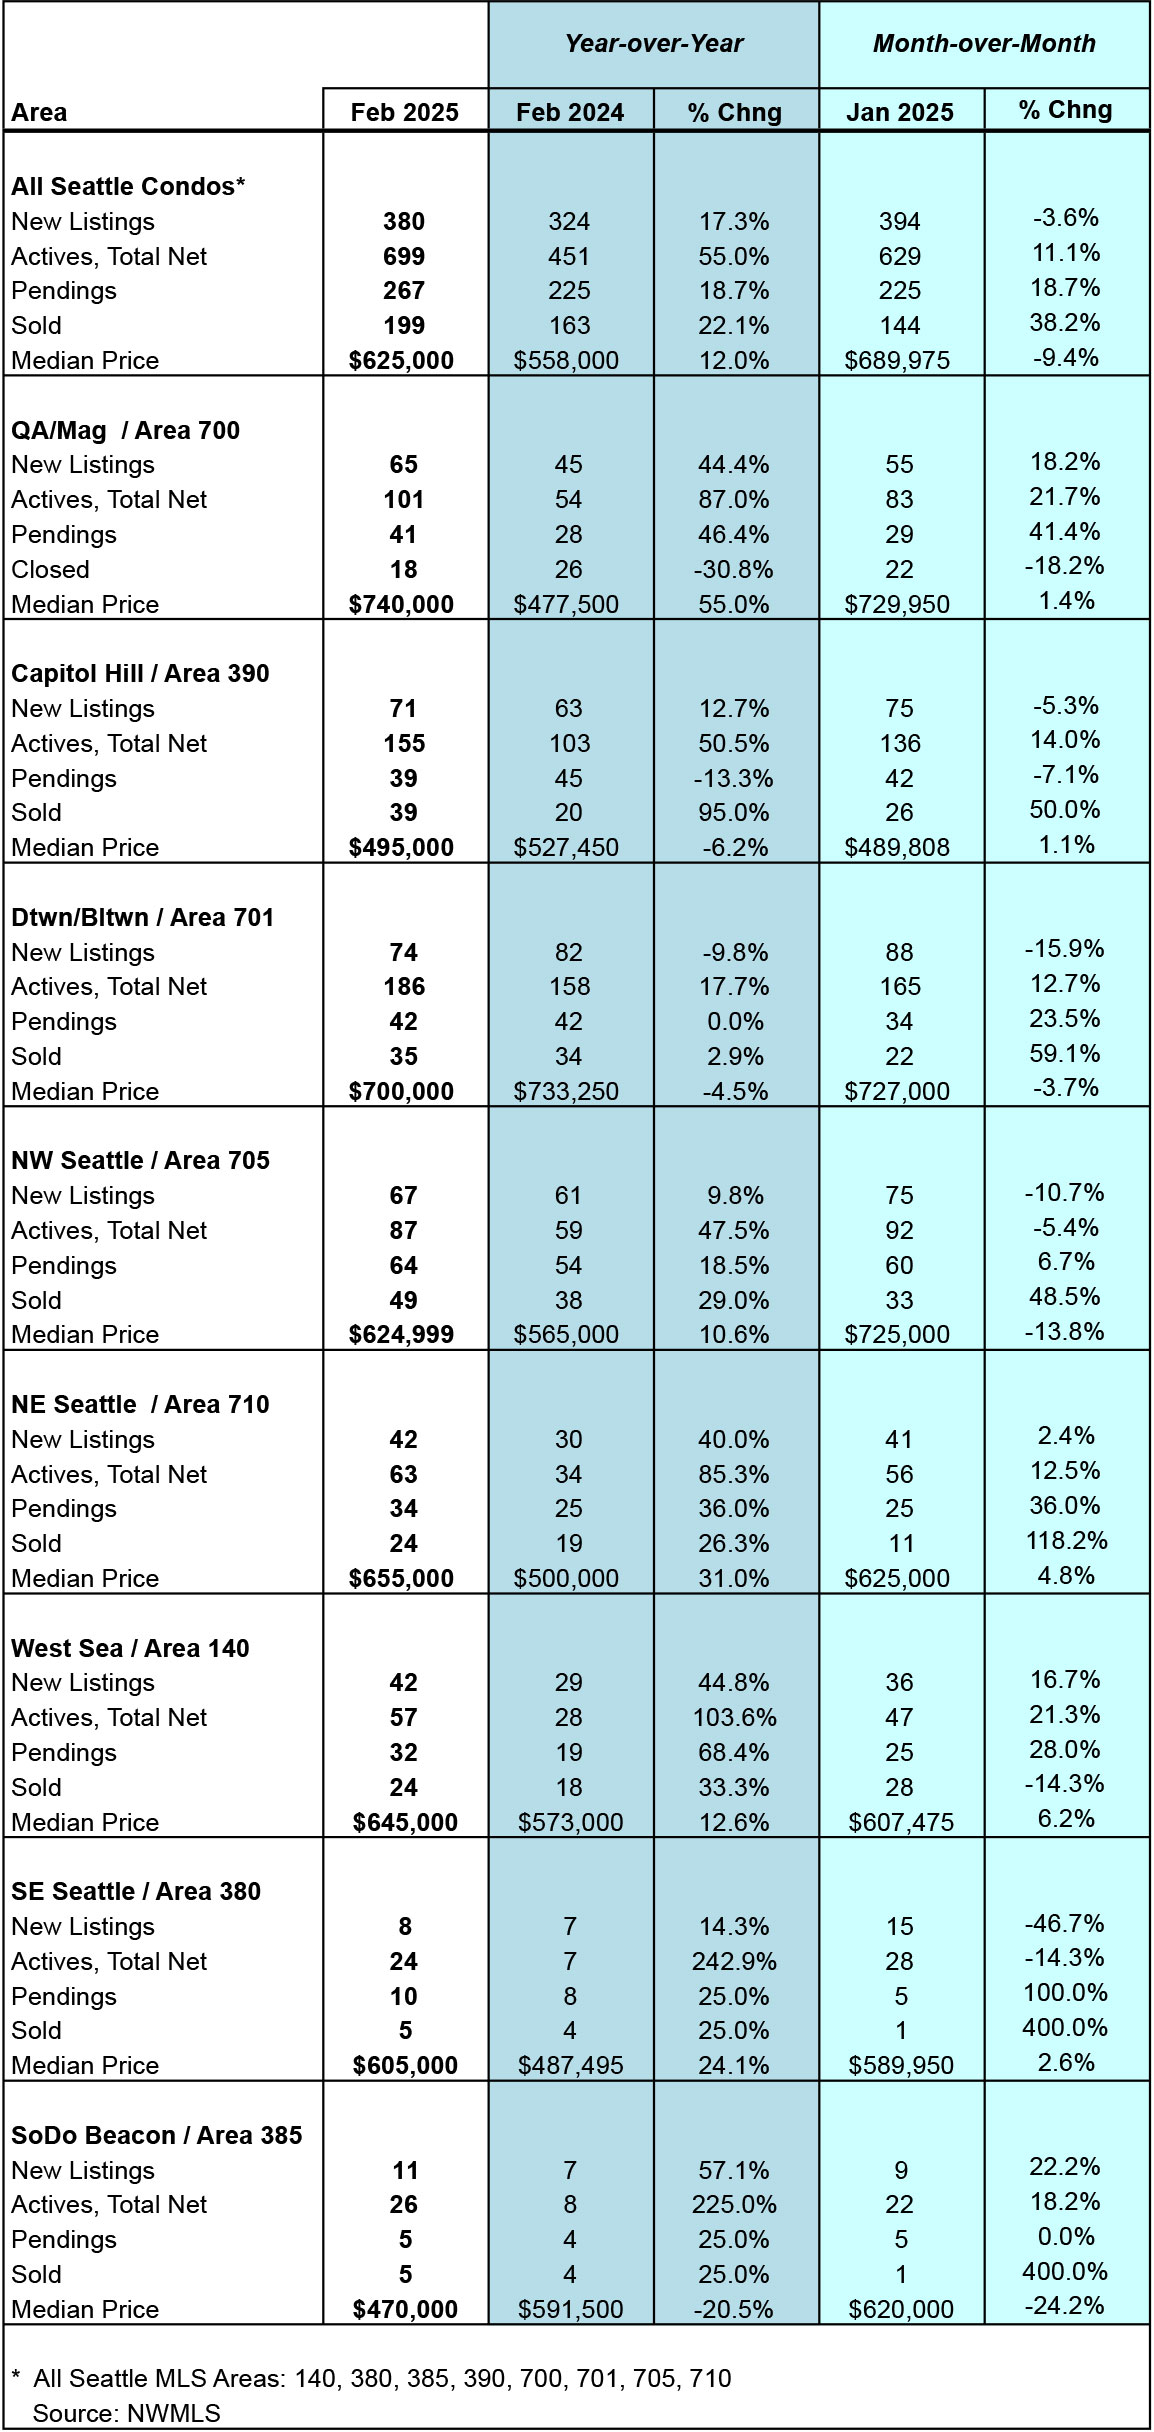
Source: Northwest Multiple Listing Service. Some figures were independently compiled by Seattle Condos And Lofts and were not published by the NWMLS.
© SeattleCondosAndLofts.com