September 2024 Seattle Condo Review

Seattle’s condo market results in September exhibited a market in flux. Unit sales and closings were down, while the number of listings and selling prices were up.
Seattle Breaks Another Record
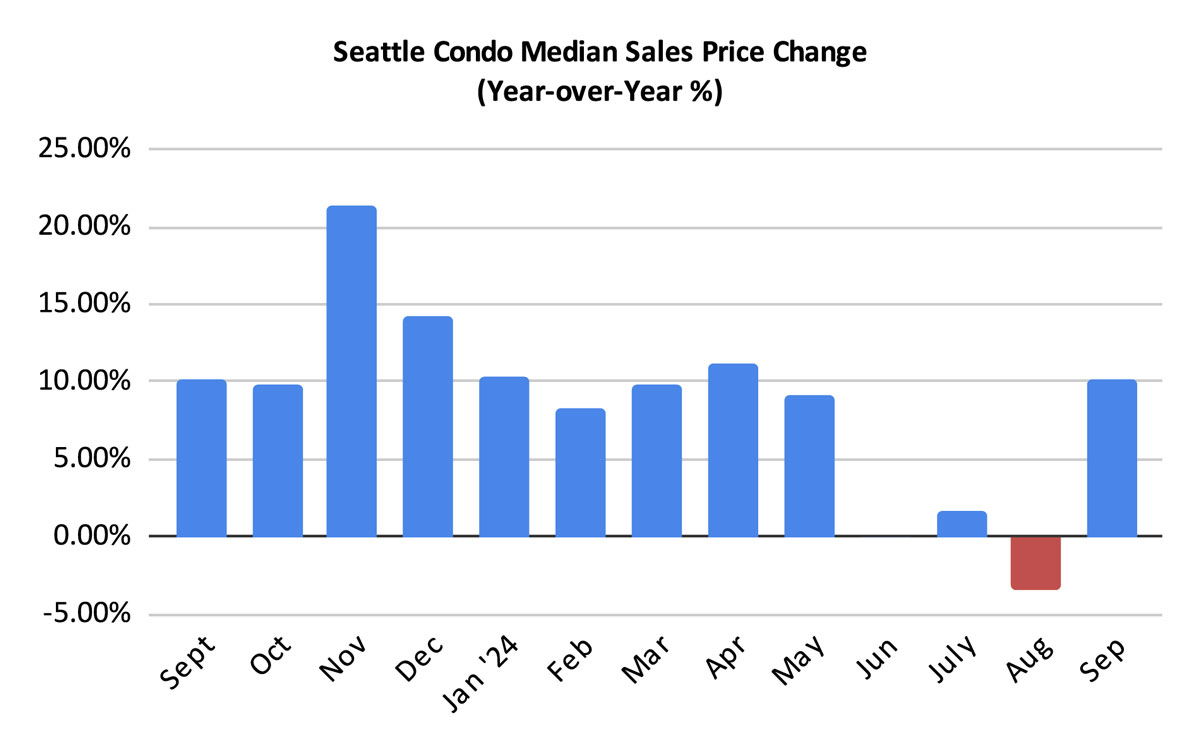
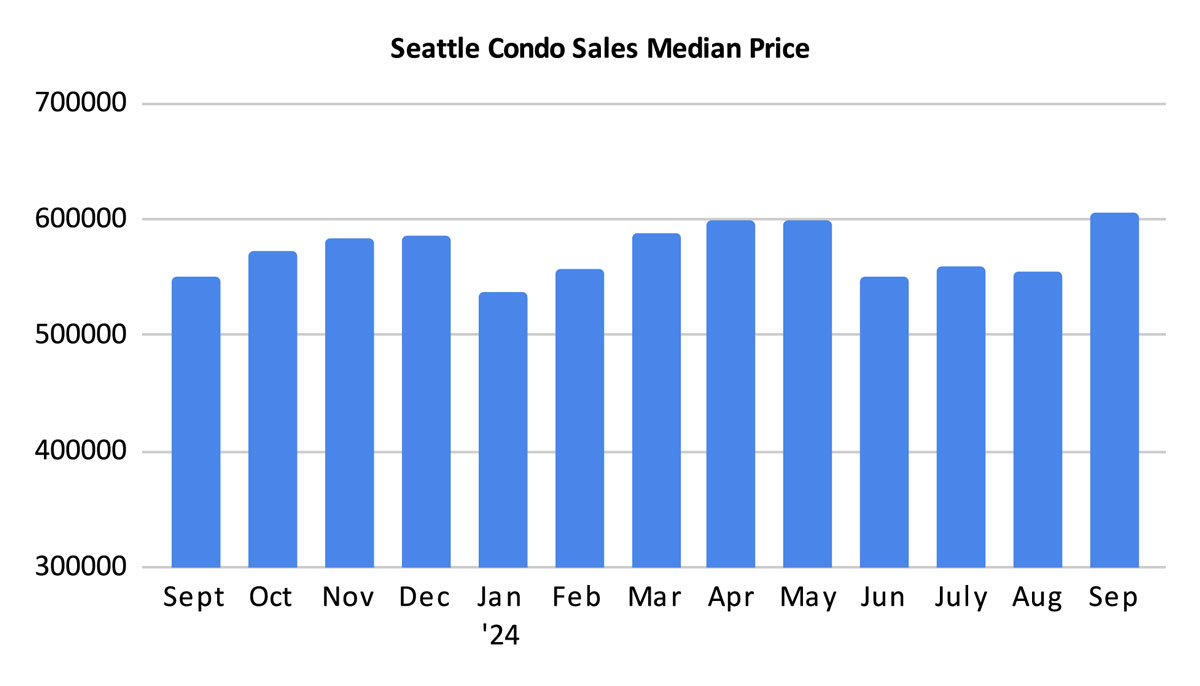
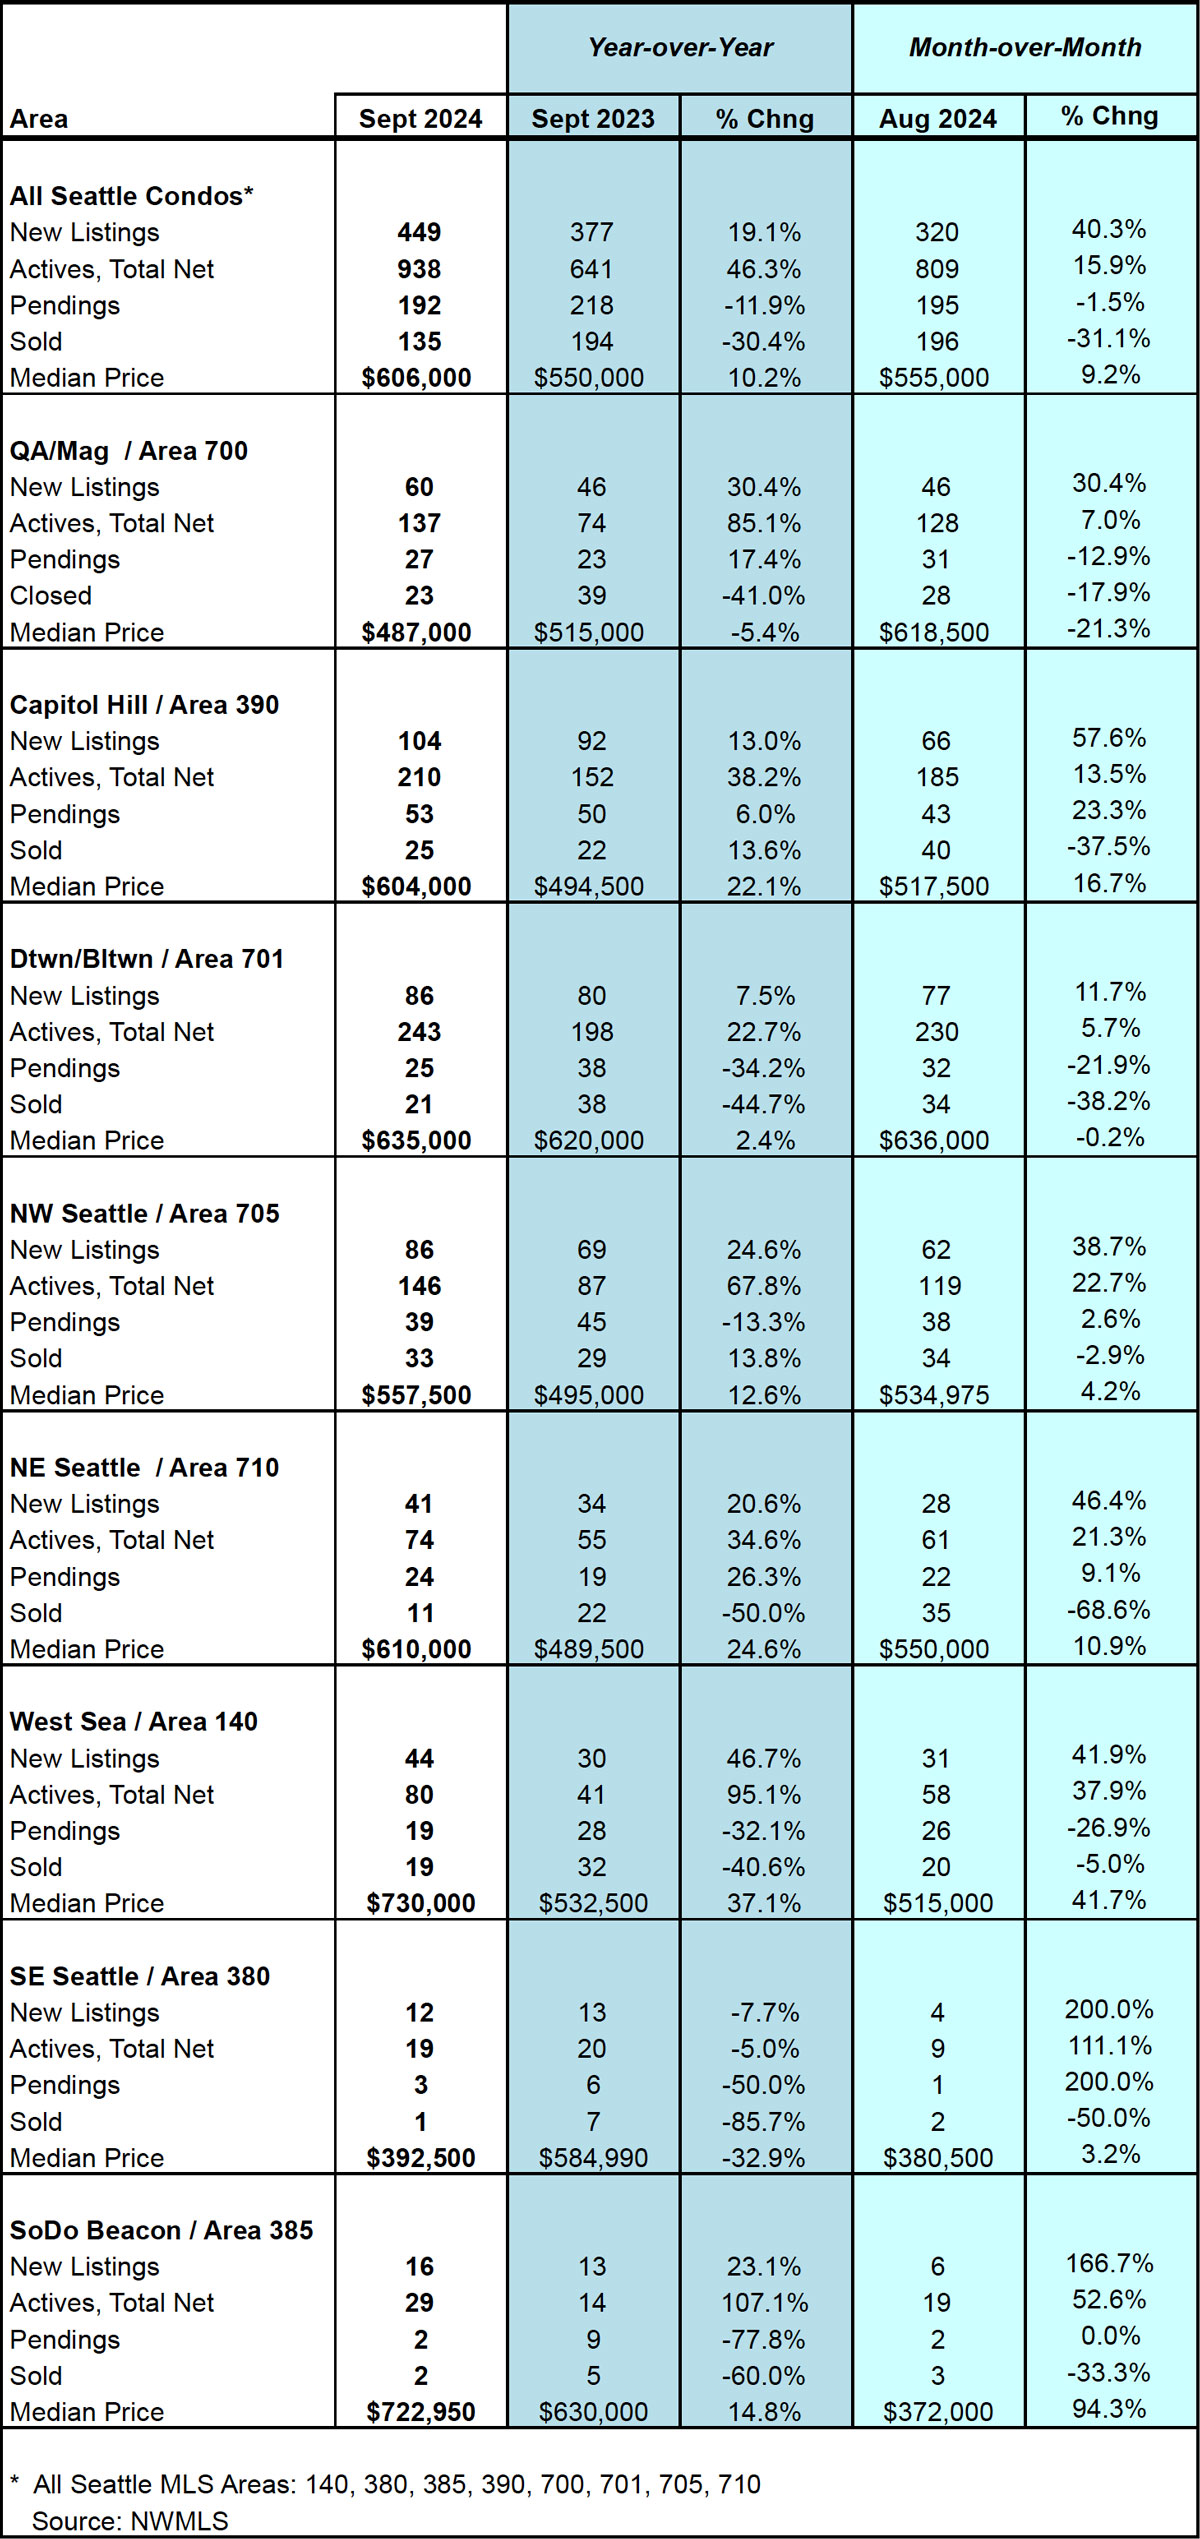
The Seattle citywide median sales price for condos came in at $606,000 last month, an increase of 10.2% year-over-year and 9.2% more than August. That’s a new record high that surpassed the $600,000 mark for the first time. And, it’s a reversal from August when the median decreased 3.5%.
On the surface, that may seem like spectacular results, price-wise, for Seattle condos. However, that’s partly due to a peculiarity in the way the Northwest MLS (NWMLS) classifies condominiums. The condo classification includes condoized single family houses, townhomes, accessory dwelling units (ADU), detached accessory dwelling units (DADU) and moorage.
These non-traditional condos comprised 28.7% of the condo closings in September and had a median sales price of $825,000.
If we exclude these properties and just looked at traditional condo units, then the median sales price would have been $525,000 in September. That, coincidentally, also reflected a 10.2% year-over-year increase, and a 5.2% one-month increase over August.
By NWMLS neighborhood area, West Seattle (+37.1%), Northeast Seattle (+24.6%), Capitol Hill / Central (+22.1%) and South Seattle (+14.8%) reflected double-digit year-over-year increases in their median selling prices. On the other hand, Southeast Seattle (-32.9%) and Queen Anne / Magnolia (-5.4%) realized decreases. See full neighborhood results here.
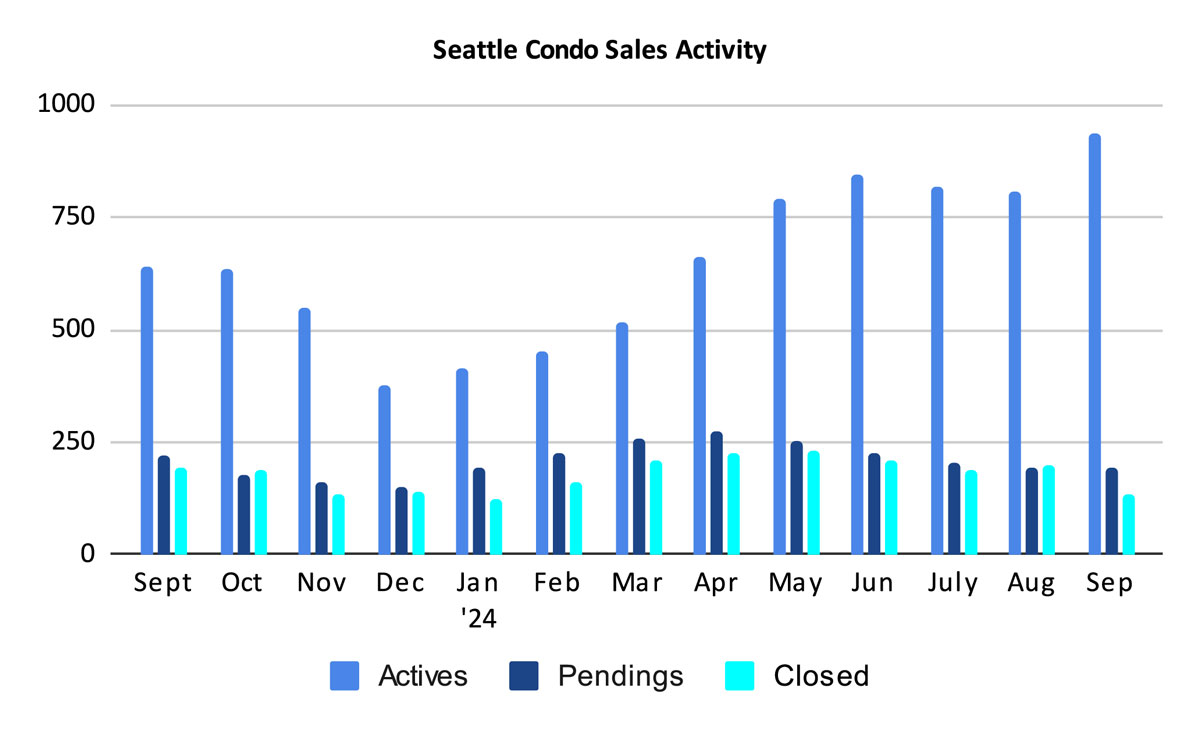
Listings Galore
Seattle ended September with 938 active condo units listed for sale in the NWMLS. That’s a jump of 46.3% more than last September and 15.9% more than August.
We started the month with 809 condo listings and sellers added 449 new listings throughout September for a total of 1,258 listings overall. Of that, 192 went into pending status and another 128 came off the market for other reasons (expired, cancelled, temporarily off market, rented, etc) leaving 938 at month end.
Interesting tidbit. This is the first time since the height of the pandemic in 2020 that Seattle had more than 900 condo units listed for sale. And, it’s only the 3rd time since 2011 that we’ve had this many listed in the NWMLS.
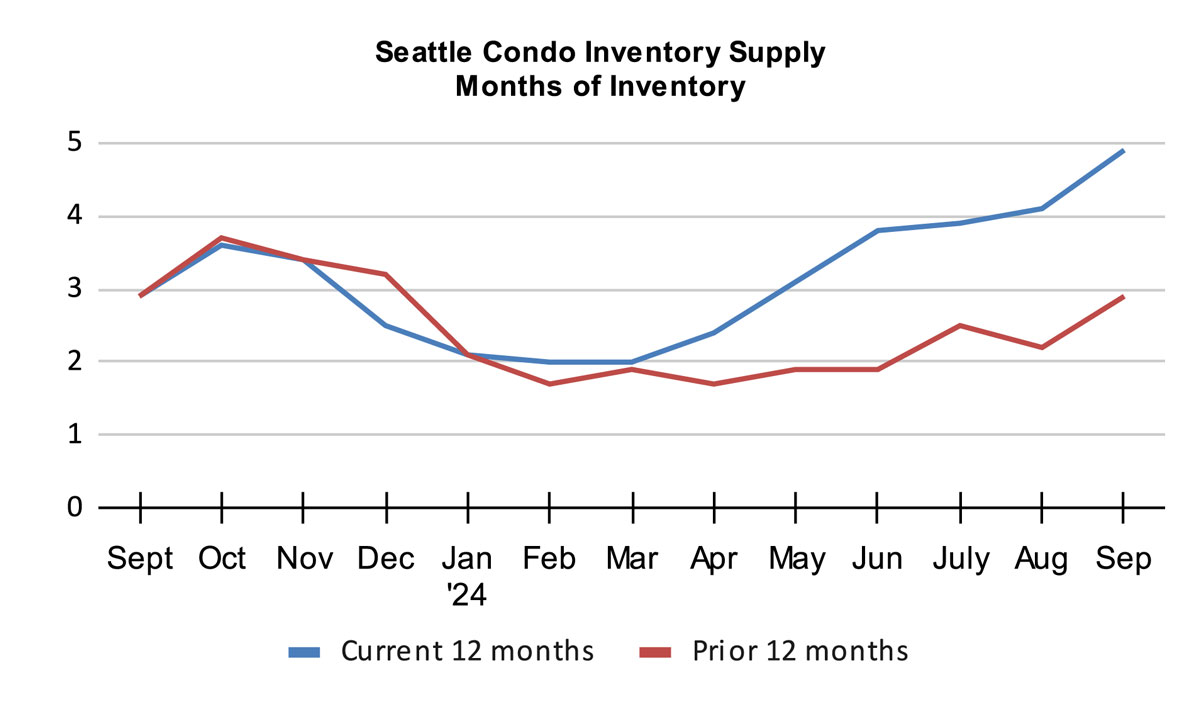
The Seattle condo inventory supply rate rose to 4.9-months of supply last month, the highest it has been since September 2011.
I think this is somewhat significant. We’ve now had two months in a balanced market, reversing a 12-year seller’s market. With the exception of November 2020, Seattle (as a whole) has been in a seller’s market since February 2012.
The inventory supply rate is a metric that characterizes market conditions / environment. A rate of less than 4-months of supply is considered a seller’s market. A rate from 4 to 7-months of supply is a balanced or normal real estate market. And, a rate greater than 7-months would be a buyer’s market.
One thing to keep in mind is the inventory supply rate and market conditions will vary with Seattle’s diverse neighborhood micro-markets. For example, condo dense downtown had a supply rate of 9.7-months, placing it firmly in a buyer’s market. On the other hand, Northeast Seattle had a rate of 3.1-months, reflecting a seller’s market. And, the 5-months of supply for Queen Anne puts it in a balanced market.
Two other notes. First, we use pending transactions in calculating the inventory supply rate, while others may use closings. Second, this is based on published listings in the NWMLS. Many developers only list a handful of their available properties for sale in the NWMLS at any given time. As such, the actual number of available units for purchase may be greater, especially in the downtown area.
The absorption rate is also used to describe market conditions and is usually expressed as a percentage. Seattle’s condo market had a 20.4% absorption rate in September, the cusp between a seller’s market and a balanced market.
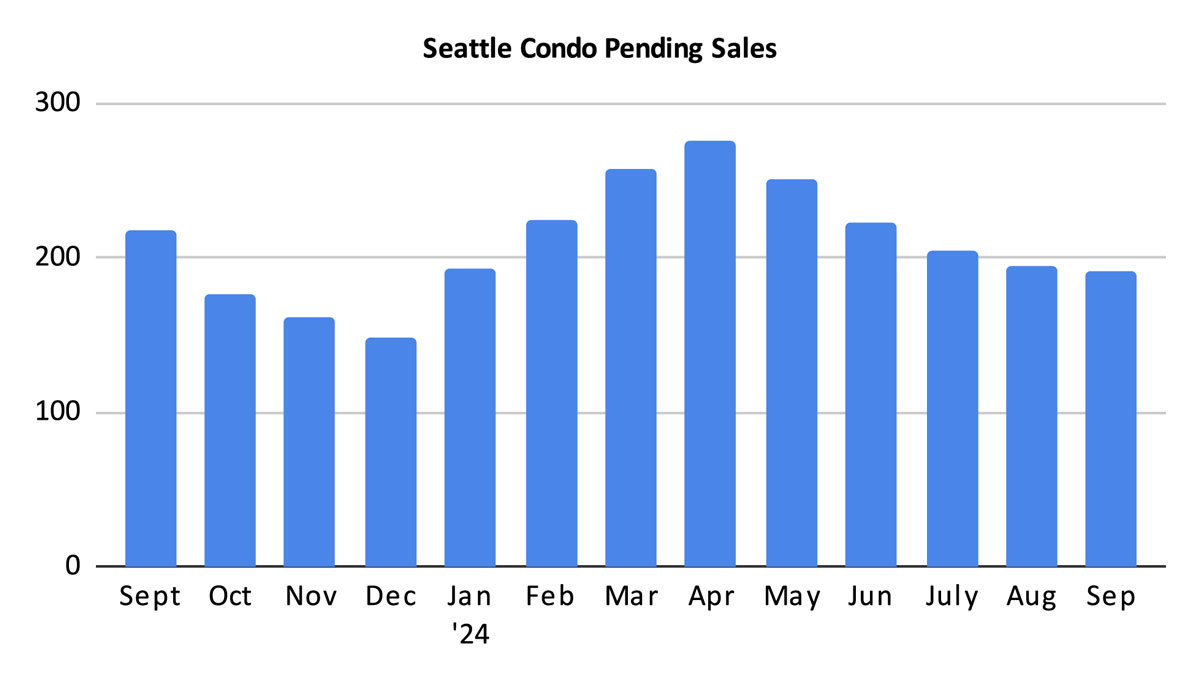
Condo Sales Dip
There were 192 pending condo sales transactions in September, which reflected a one-year and a one-month decrease of 11.9% and 1.5%, respectively. Historically, Seattle’s real estate market slows during the second half of the year so we anticipate sales will trail off through the end of the year. Though, interest rates had risen over the past month that could have given buyers pause as well.
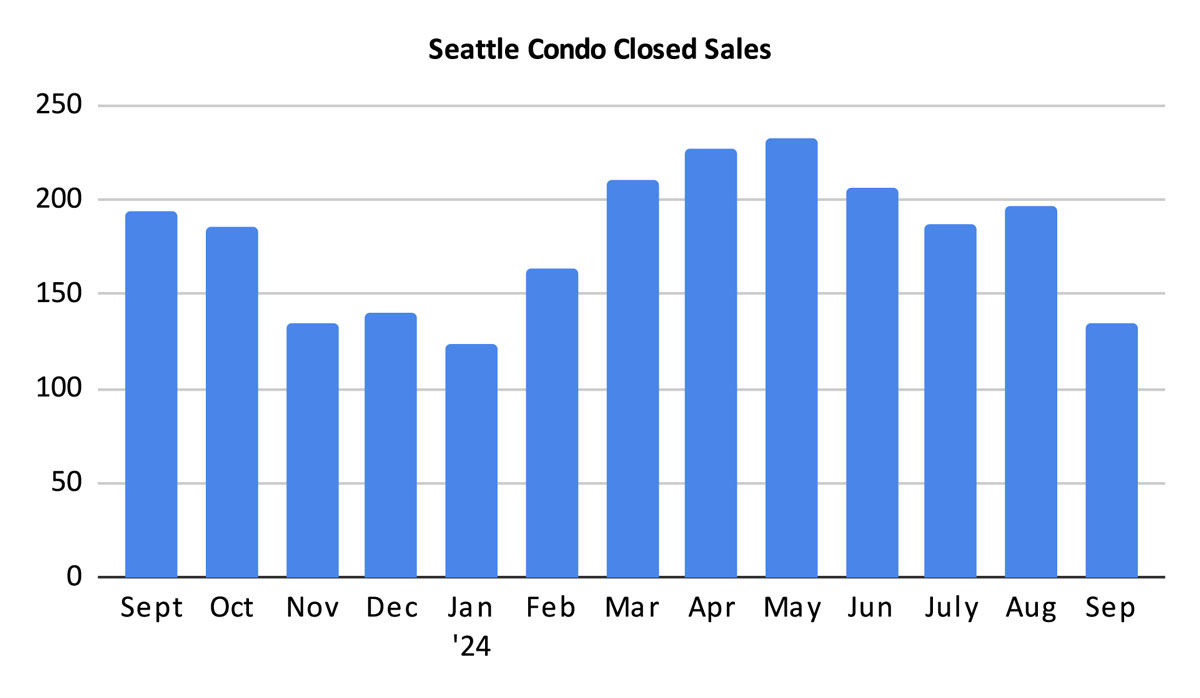
The number of closed condo sales also dropped, rather significantly to 135 units. September exhibited 30.4% fewer sales compared to the same period last year, and 31.1% fewer than the month prior.
Closings lag behind pendings, so with fewer pendings we’d expect fewer closings, but September’s closings were lower than anticipated. It is likely due to pendings taking longer to close or buyers backing out of the purchase. If the former, then we may see closings increase in October. Though, as with pendings, this will trend downward through year end.
In Summary…
There were a few surprises resulting from September’s Seattle condo market statistics. The citywide Seattle condo median sales prices surpassed $600,000 for the first time resulting in a new all-time record high.
And, the number of listings for sale eclipsed 900 units the first time since the height of the pandemic in 2020, and just the third time overall since 2011. This moved Seattle to a balanced market environment from a decade plus seller’s market.
Condo unit sales decreased, though that’s not unexpected given the market’s seasonal and cyclical characteristics.
As we enter the tail end of the year, condo sales will continue to decline and prices should dip if we keep to historic trends.
For buyers, the conditions are in your favor – declining prices, plenty of inventory and greater negotiating power. Though, mortgage rates are in a state of flux and higher than there were a month ago. And, some lenders are getting tougher on condo loans.
For sellers, the current market may be more of a challenge for you. Though, that will depend on location and price point. Desirable areas with fewer condos such as North Seattle still has a strong market compared to the condo dense areas of downtown and Belltown. Expect longer days on market timelines and lower selling prices for traditional condos.
Seattle Condo Market Statistics September 2024
Source: Northwest Multiple Listing Service. Some figures were independently compiled by Seattle Condos And Lofts and were not published by the NWMLS.
© SeattleCondosAndLofts.com