Seattle Condo Report August 2024

Seattle summers are getting warmer, but the same can’t be said of Seattle’s condominium market. August results showed the market cooling ahead of our slower Fall season. The number of listings, selling prices and sales units reduced last month.
Seattle Condo Prices Soften
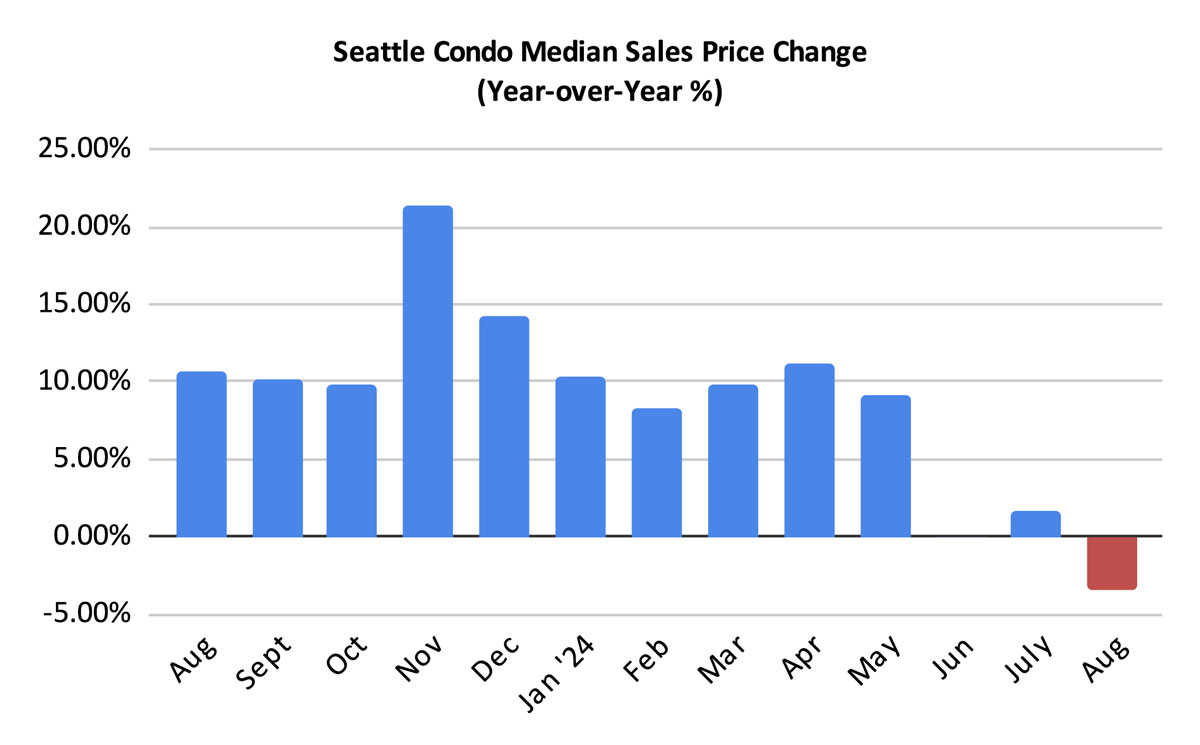
The Seattle citywide condo median sales price was $555,000 in August, marking a year-over-year (YOY) and a one-month decrease of 3.5% and 0.7%, respectively. August reversed a 15-month YOY increase trend.
However, several NWMLS neighborhood areas did eke out slim YOY gains for the month. Downtown/Belltown (+1%), Queen Anne/Magnolia (+1.6%), West Seattle (+4%), Northeast Seattle (+7.8%) all reflected increases in their median selling prices. The notable decreases were Capitol Hill / Central (-10%) and Northwest Seattle (-12.7%). South Seattle had a YOY decrease of around 38%, but that was based on an insignificant sample size of 5 units. See full neighborhood results here.
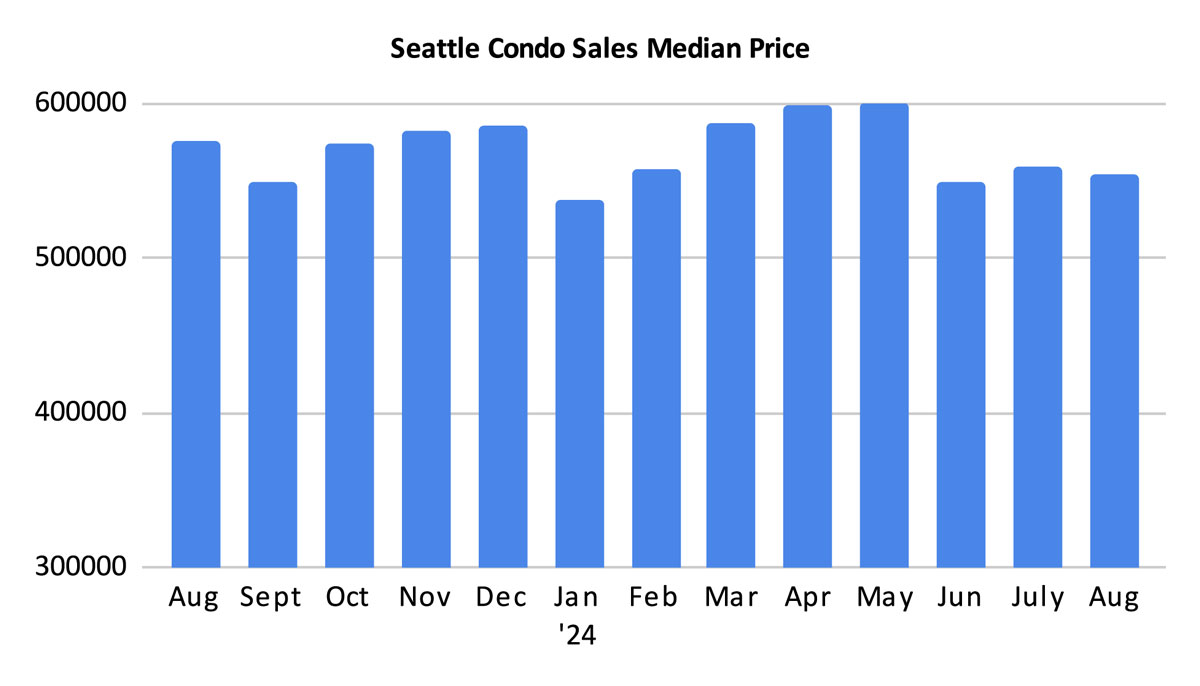
Our MLS includes a number of properties that we would not think of as being condos. These non-traditional properties classified as “condos” include single family houses, townhomes, ADUs, DADUs and boat moorages. They are typically newer, larger and more expensive and accounted for 17% of the condo sales in August.
If we exclude these, then the Seattle citywide condo median sales price would have been $498,750 in August instead of $575,000. Compared to the prior month, we would have had a 3.9% increase, and YOY we would have had a slight increase of 0.5%.
Inventory Retreats
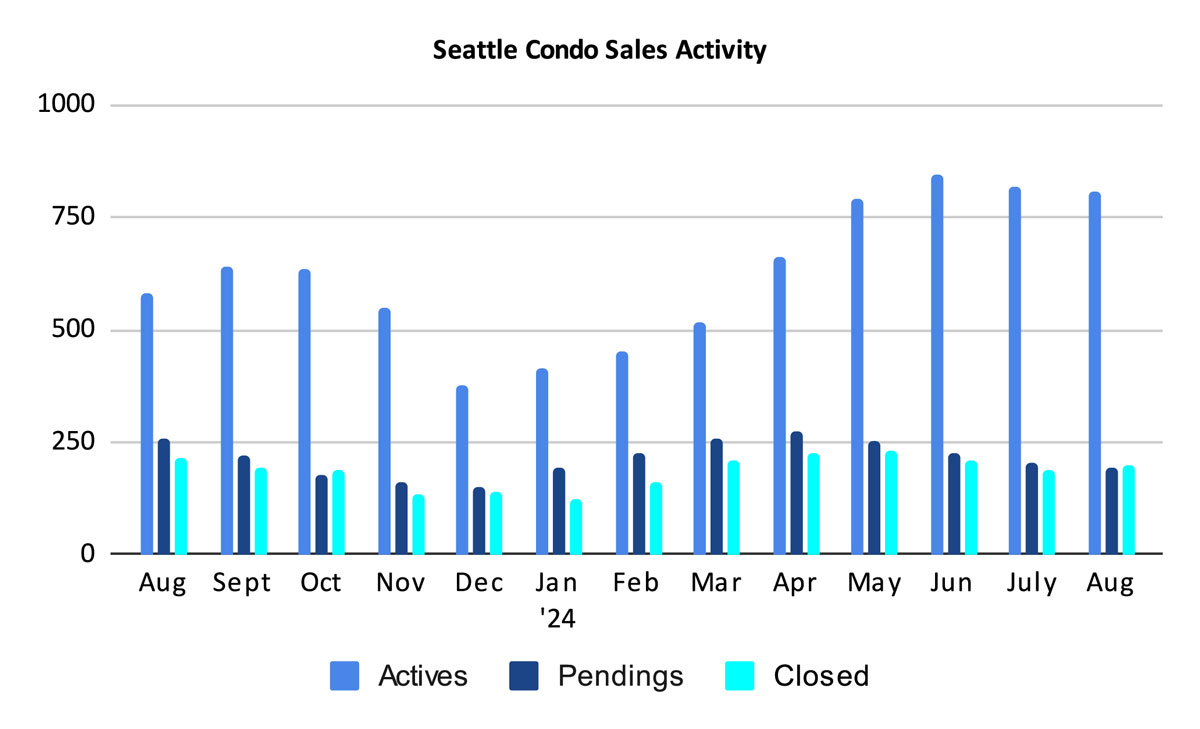
The active number of Seattle Condo listings stabilized in August with 809 units for sale at month’s end, just 1% fewer than the previous month and starting to trend downwards. Compared to a year ago, though, inventory was up 39.5%.
Sellers brought fewer listings to market last month with 320 new condo listings. That’s 4.3% fewer than a year ago and down slightly by 0.9% from the previous month.
Overall, there were 1,137 condo units listed for sale in the Northwest MLS in August. We started the month with 817 and added 320. Of that, 195 went under contract while 133 units came off the market for other reasons (e.g. expired, cancelled, relisted, temporarily off market, rented), leaving 809 units at the end of the month.
A Balancing Act
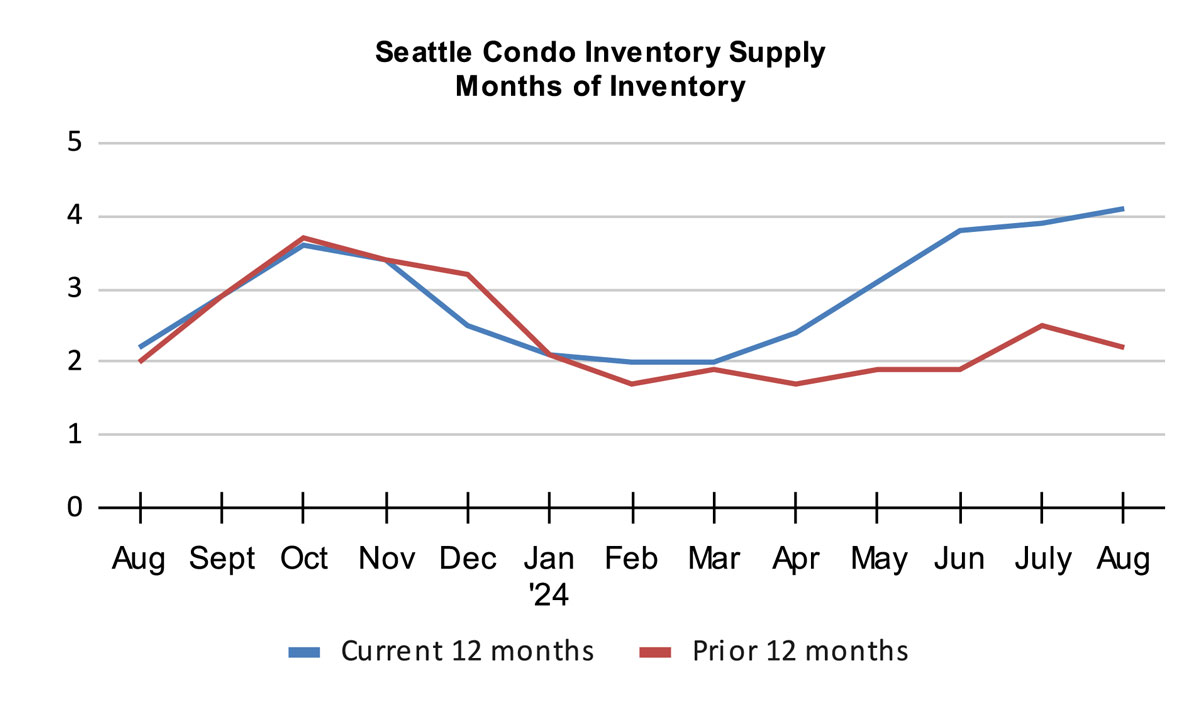
For just the second time over the past 12+ years, Seattle crossed the threshold from a seller’s market to a balance market. The drop in condo sales in August resulted in a higher inventory supply rate of 4.1-months of supply.
The inventory supply rate metric characterizes market conditions. Typically, a rate of less than 4-months of supply is considered a seller’s market. A rate from 4 to 7-months of supply is a balanced or normal real estate market. And, a rate greater than 7-months would be a buyer’s market.
While the city as a whole, as at least in August, moved to a balanced market, buyers and sellers will encounter differing experiences relative to their local neighborhood micro market. For example, in condo dense downtown/Belltown the supply rate was 7.2-months of supply based on NWMLS listed properties placing it in a buyer’s market.
On the other hand, West Seattle (2.2-months) and Northeast Seattle (2.7-months) reflected seller’s market conditions. And, that corresponded with both having the highest YOY increase in their median sales price last month.
Besides location, price points will impact buyer and seller experiences. The lower, more attractive price points for most first-time condo buyers will be more competitive than high-end, luxury properties.
Buyers Slumber
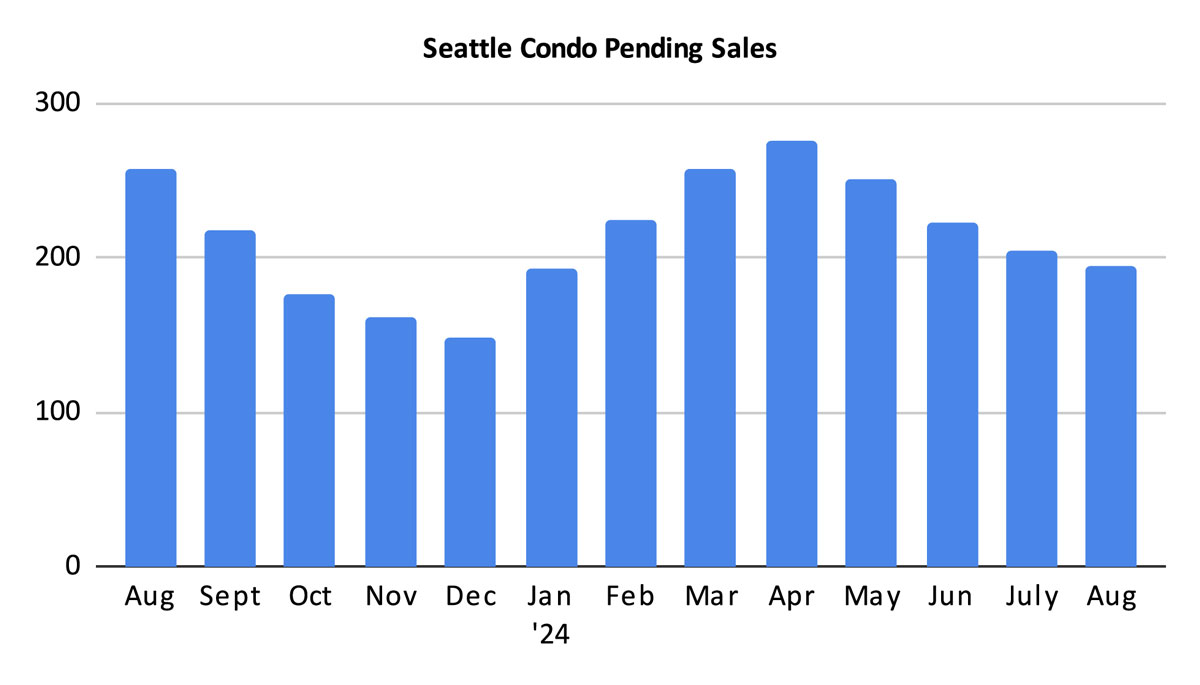
Even with lower interest rates and ample inventory options, buyers are slumbering on the sidelines. Condo pending sales (listings under contract in escrow), reduced for the 4th straight month in a row with just 195 pendings units in August. That exhibited a one-year drop of 24.4% and a one-month dip of 4.9%.
Now, Seattle’s real estate market is cyclically following the seasons. So as we move past summer we anticipate that sales will trend downwards through December. However, it appears we’ve started that downward movement a little earlier this year.
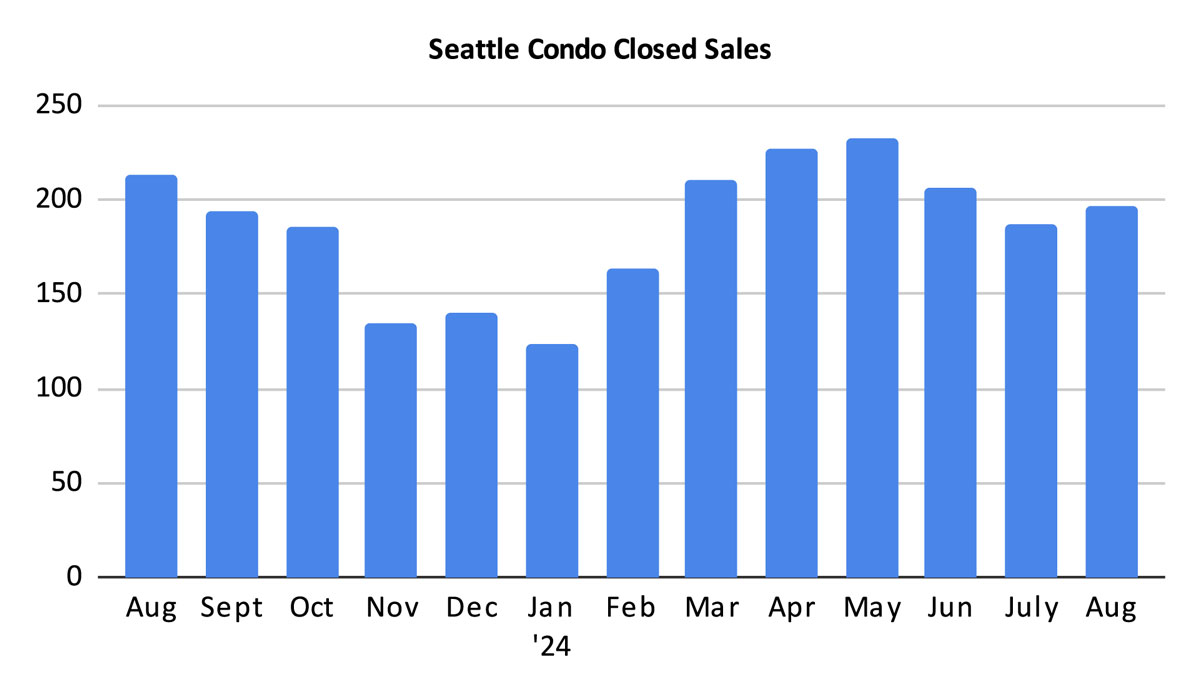
With that said, there was a slight increased of 4.8% in the number of closed sales, 196 units, compared to the prior month. However, compared to the same period last year, closings were down 8%.
Closings typically lag behind pendings by a month so we’ll see closings trend downward, likely through the remainder of the year.
In Summary
Our typical Fall real estate market conditions came early this year. The Seattle condo market cooled in August and moved Seattle into a balanced or normal market place. So far, this is only the second time (second month) since early 2012 that Seattle dipped its toes out of a seller’s market and into a balanced market. It’ll be interesting to see how long it will last.
Lower interest rates and ample inventory haven’t spurred buyers to the market, noted by fewer condo sales over the past several months. As we head towards the Fall season, unit sales and selling prices will further trend downwards.
For buyers, the conditions are in their favor – lower mortgage interest rates, declining prices, plenty of inventory and greater negotiating power.
For sellers, the current market may be more of a challenge. Though, that will depend on location and price point. Desirable areas with fewer condos such as West Seattle and North Seattle, are still strong markets, compared to the condo dense areas of downtown, Belltown and Capitol Hill.
Seattle Condo Market Statistics August 2024
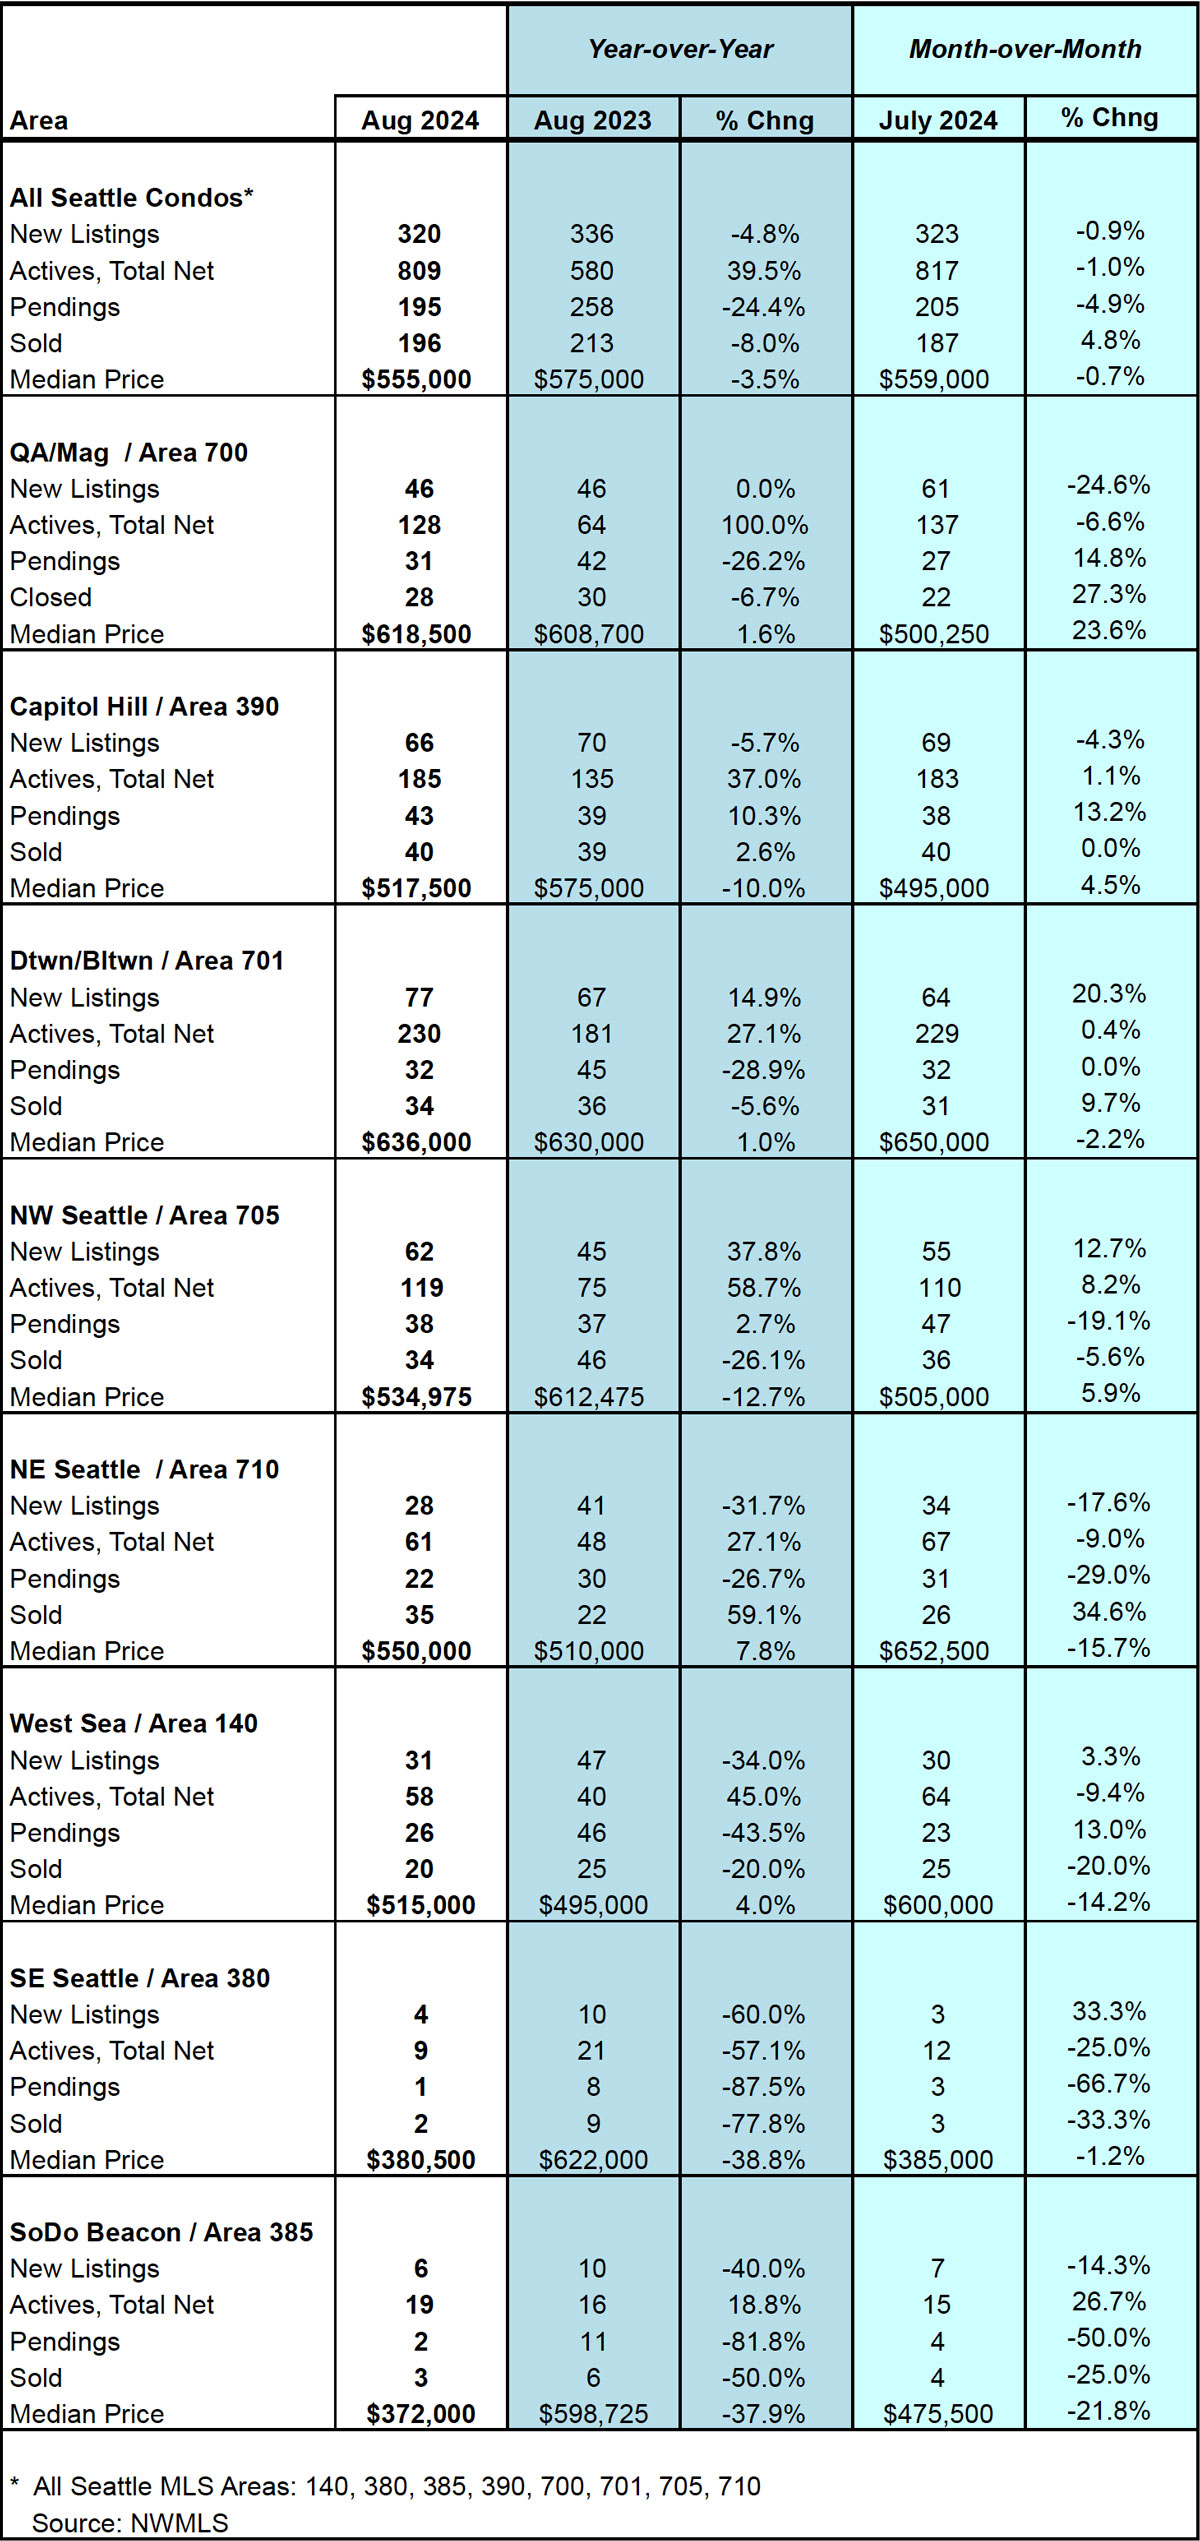
Source: Northwest Multiple Listing Service. Some figures were independently compiled by Seattle Condos And Lofts and were not published by the NWMLS.
© SeattleCondosAndLofts.com


