November 2021 Seattle Condo Market Update
The start of the fall and holiday season did not slow down Seattle’s condo market in November, which experienced strong unit sales activity and reduced inventory.
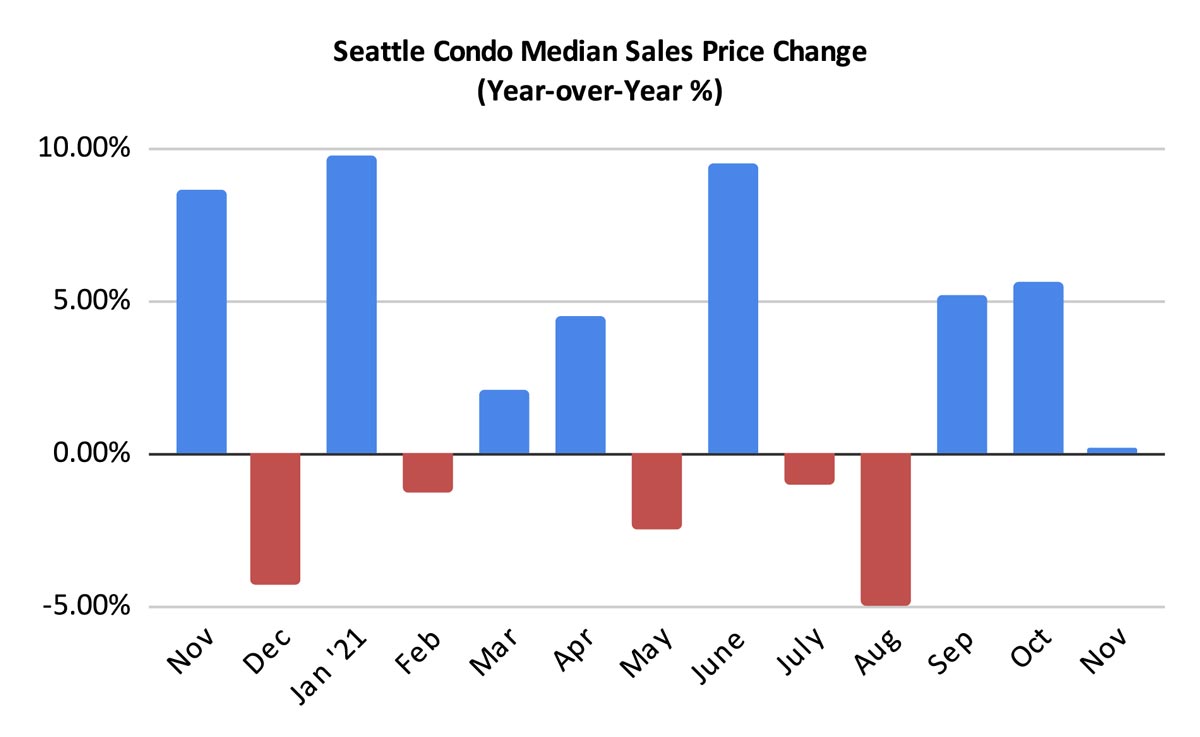
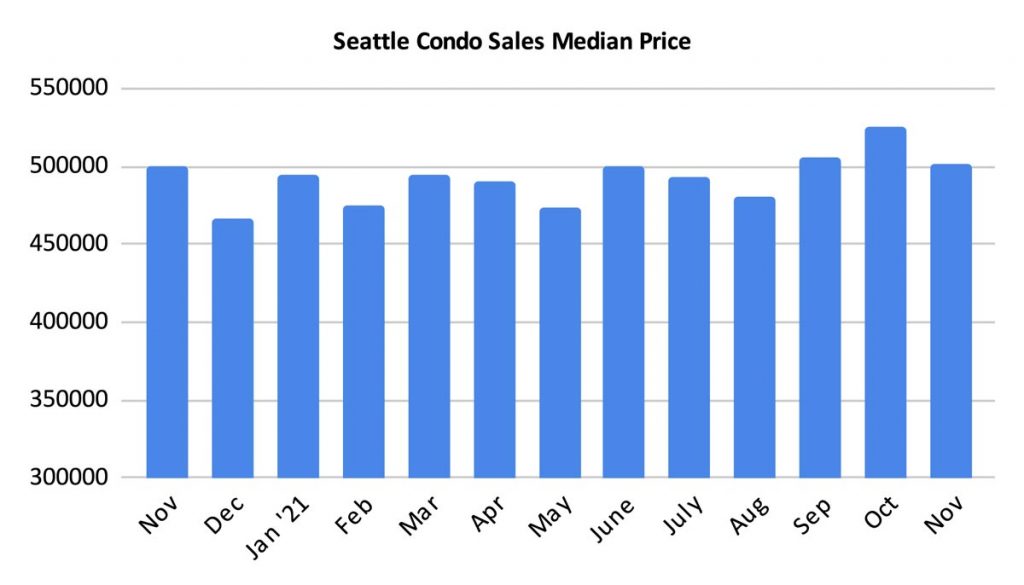
Overall, the citywide median sales price of $500,999 for Seattle condos remained stable and on par with last November, though 4.6% less than October.
By MLS area, most neighborhoods reflected increases in median sale prices with northwest Seattle (+13.1%) and downtown (+8.9%) realizing the greatest year-over-year (YOY) increase, while Queen Anne reflected the largest one-year drop of 16.1% for the month. See table at bottom for more area details.
Seattle Condo Inventory Shrinks Further
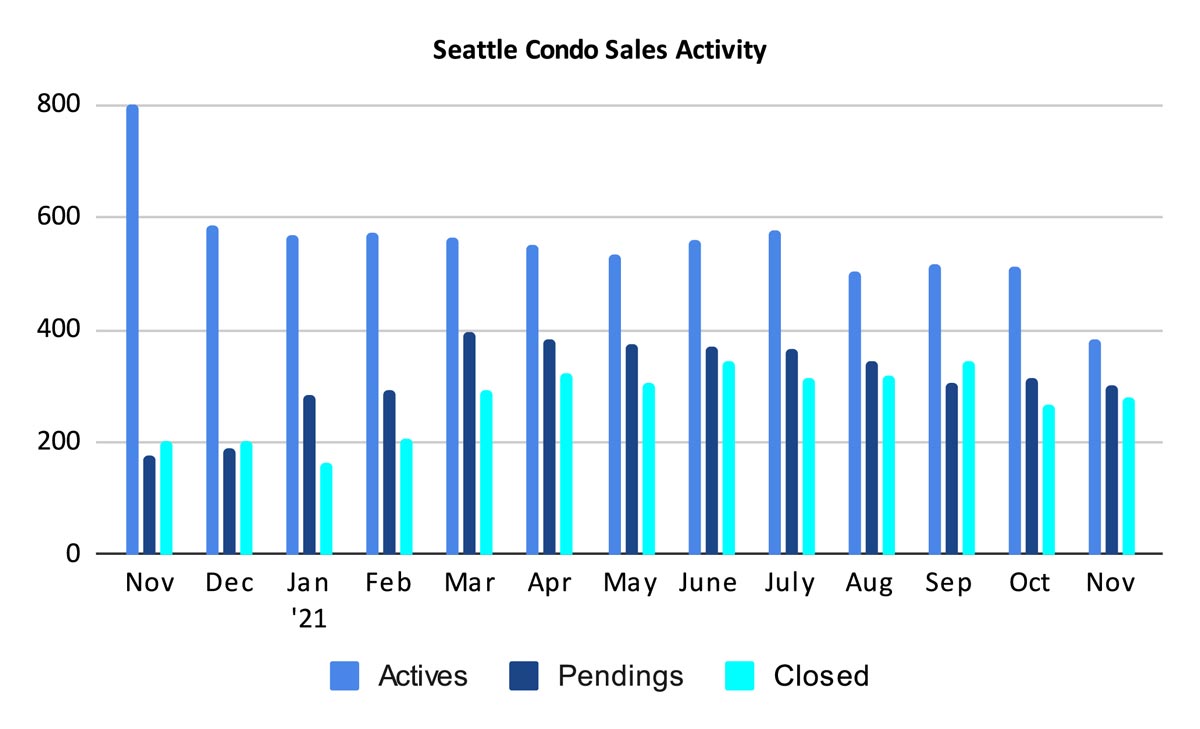
The number of active MLS listed Seattle condos for sale reduced to its lowest level since March 2020, just as the pandemic released havoc on the local condo market. The 383 units for sale in November reflected a 52% decline YOY and 24.9% fewer than October.
Though, as mentioned in prior monthly updates, this number is based on listed properties in the Northwest MLS database, which does not include the overwhelming majority of recently completed condos at Koda, Emerald and Spire. It also does not include presale opportunities at Graystone, First Light or Infinity Shore. As a result, the true number of available Seattle condos is much higher. In actuality, we are essentially even with last November’s inventory.
Keep in mind, however, this predominantly pertains to the downtown area (city center, Belltown, Pioneer Square, Denny Triangle), where most of the new condo buildings are located.
Conversely, Queen Anne, North Seattle (Ballard, especially), West Seattle and Capitol Hill are experiencing a considerable reduction in listings.
Condo Sales Activity Remains Robust
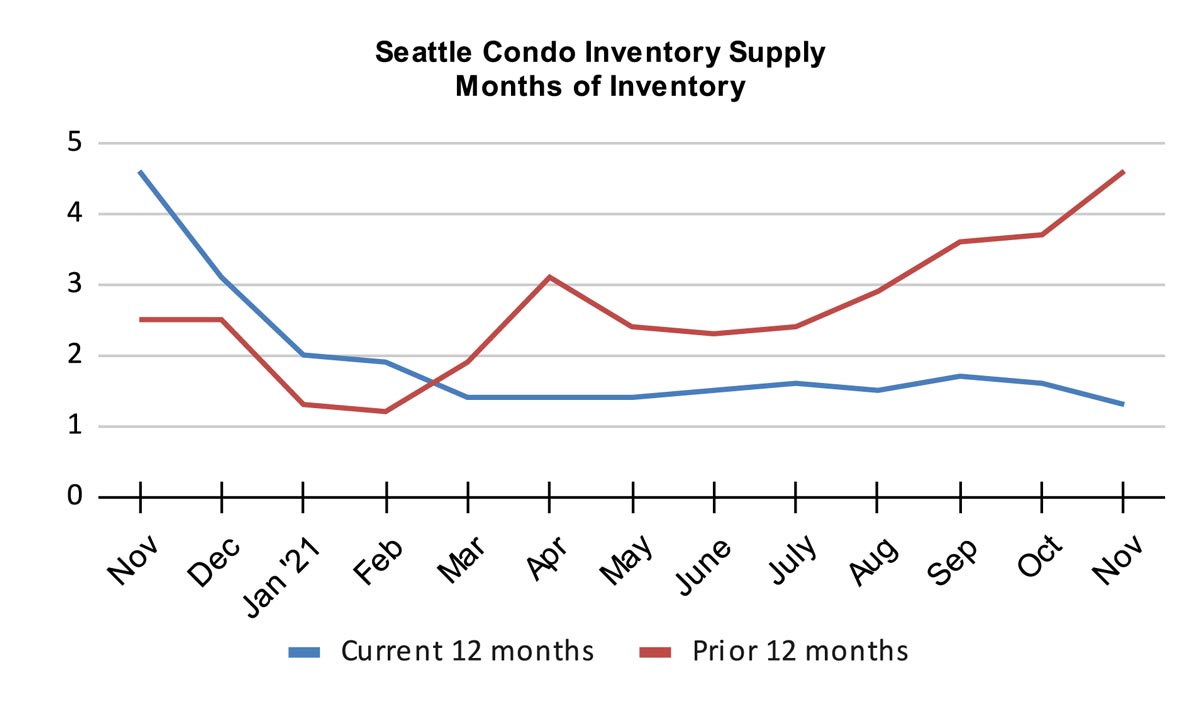
The Seattle housing market has been phenomenal, particularly our condo market which as been in a seller’s market since Spring of 2012. That’s nearly a decade long run. There was one anomaly during that period, which occurred last November when the inventory supply rate rose to 4.6-months of supply, moving us ever so briefly into a balanced or normal market environment.
Exactly one year later, the Seattle condo market was back to one of its tightest with 1.3-months of supply based on pending transactions.
The “months-of-supply” metric characterizes the housing market environment. A supply rate of under 4-months of supply is classified a seller’s market, between 4 to 6-months is considered a balanced/normal market, and over 6 months would be a buyer’s market.
We use this to describe the overall Seattle condo market as a whole. However, taking the neighborhood micro-markets into consideration, buyers and sellers will experience differing conditions in terms of location and price points.
For example, in North Seattle, particularly Ballard, inventory is tight with demand outpacing supply. Contrast that with downtown, where we have an excess of inventory (including new construction) and higher values, it’s more indicative of a buyer’s market.
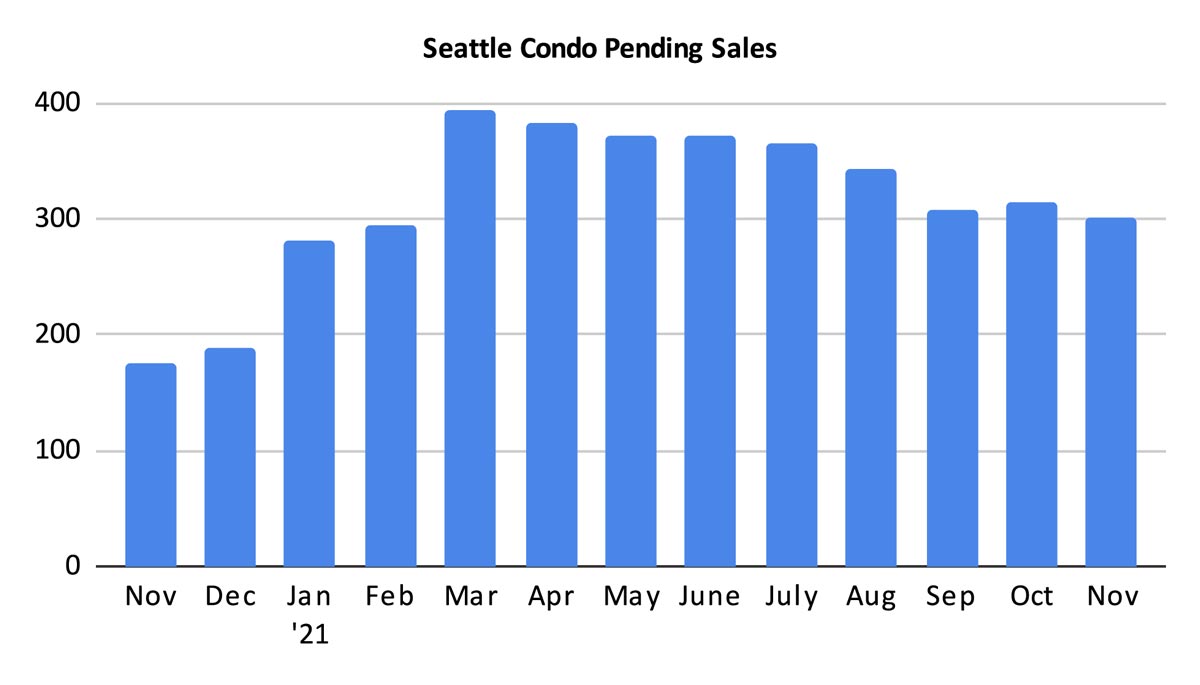
Condo pending sales transactions in November exceeded expectations jumping 72.6% YOY to 302 units under contract. All areas of the city reflected double-digit improvements in sales with the standout being the downtown area, which saw a 131% increase in condo sales. Approximately 20% of the pendings were for units in the newly completed buildings.
There were fewer pendings compared to the prior month, down by 4.1%, but that’s normal with our seasonal market; the fall season is the slowest of the year.
Closed condo sales also exhibited an increase, improving 39% YOY and 4.9% over the prior month, to 278 closed units. Closings typically following pendings by a month, so this number should remain fairly even for December.
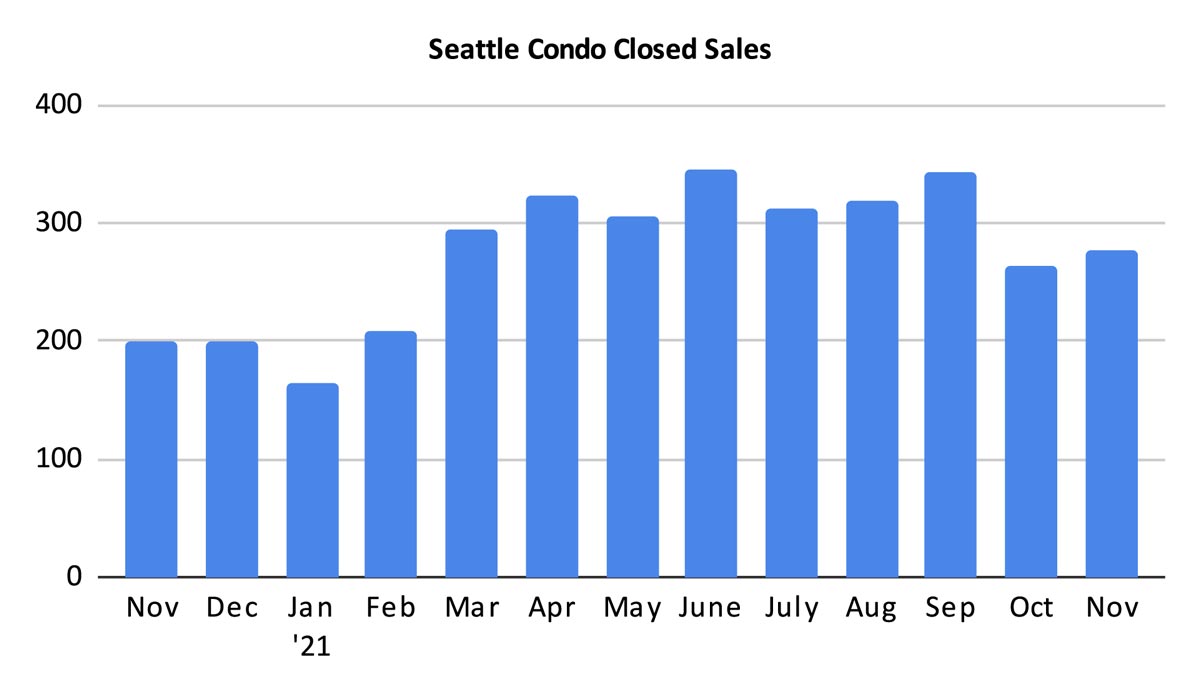
November’s increase in Seattle condos sales, stable selling prices and low inventory was a solid way to begin closing out the year. December, which typically has the fewest number of sales, is so far holding true to form. While December’s number won’t be as strong as November, it should still outpace last December and provide a strong start to the new year.
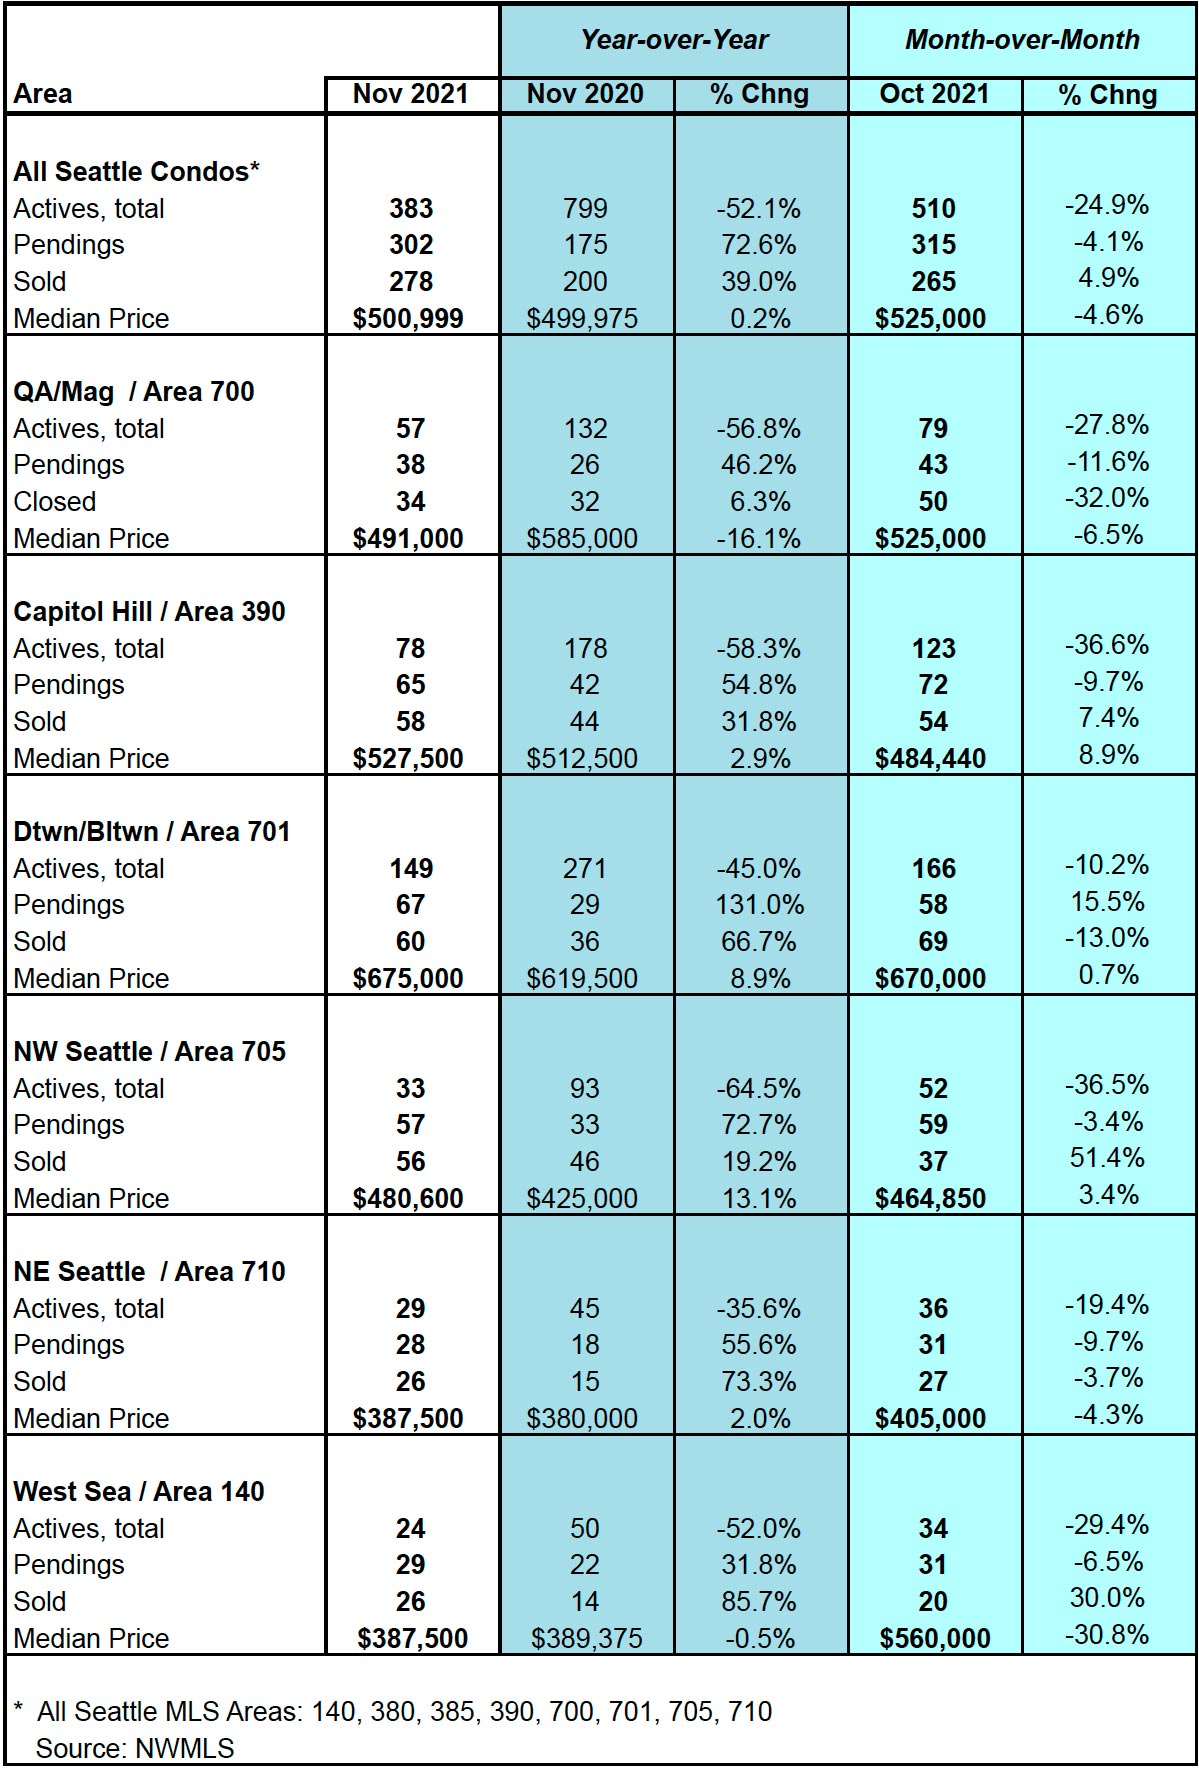
Source: Northwest Multiple Listing Service. Some figures were independently compiled by Seattle Condos And Lofts and were not published by the NWMLS.
© SeattleCondosAndLofts.com


