Seattle Condo Market Update
First Quarter Condo Market Performance
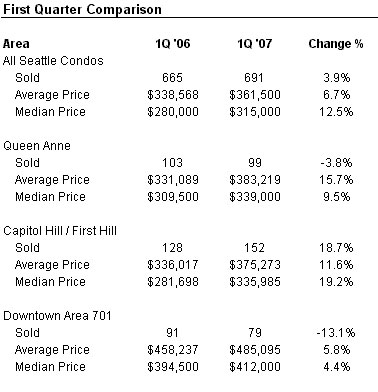
Seattle’s first quarter 2007 condo sales figures exhibited a healthy market performance compared to the same period last year. The chart below shows Sold information for city-wide condo sales as well as selected downtown core neighborhoods.
March 2007 Condo Market Performance
The one month figures from February to March showed a different picture. As expected with seasonal market fluctuation, the number of sales increased in March. However, the core neighborhood values took a hit in March from the prior month.
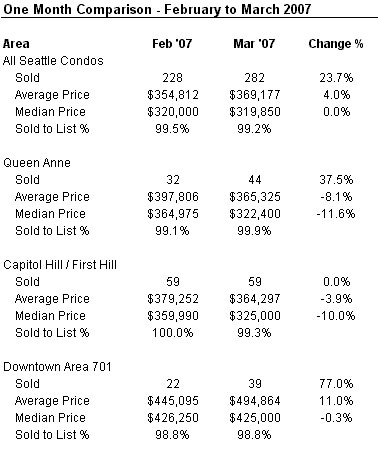
Keep in mind, the one month change, in and of itself, is not as meaningful as trending.
Price Per Square Foot – all Seattle Condos
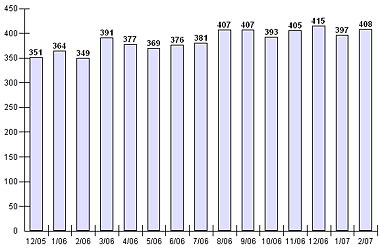
The All Seattle Condos category include aggregate figures for NWMLS areas 140, 380, 385, 390, 700, 701, 705 and 710. Downtown Area 701 includes Downtown, Belltown, Denny Triangle, Pioneer Square and the International District.
Source: NWMLS & Trendgraphix. Information deemed reliable but not guaranteed.



Great use of stats in this post. Very concise, some good images to break things up, and a little bit of commentary to make it your own. Good work!
Fantastic market report Ben. I loke the way you pesent your market. I hope you don’t mind if I visit occasionally. I’d like to move into the urban condo niche in salt Lake City and it looks like I could learn alot from you.
Keith – thanks for stopping by and for the kind words. Is the SLC area the next condo hotspot?
The SLC Urban condo market is really heating up. The next 12 months will tell whether the demand is real. We have over 1,000 new units under construction. Investor demand has been hot picking up much of the new units on speculation. I think those that can hold long enough for a reasonable saturation will do well. But, some will panic and unlaod them. That’s just a view from my crystal ball. The longterm view for condos in Salt Lake is very good.