Seattle Condo Market Recap – September 2026
With the second half of the year underway the Seattle condo market is charting along with its seasonal slowdown. Listings rose, sales reduced, and surprisingly, the median sales price increased in September. As we head into the Fall season, the market will slow further and we’ll start to experience fewer listings along with continued decreasing sales and falling prices.
September Surprise – A little bump in selling prices
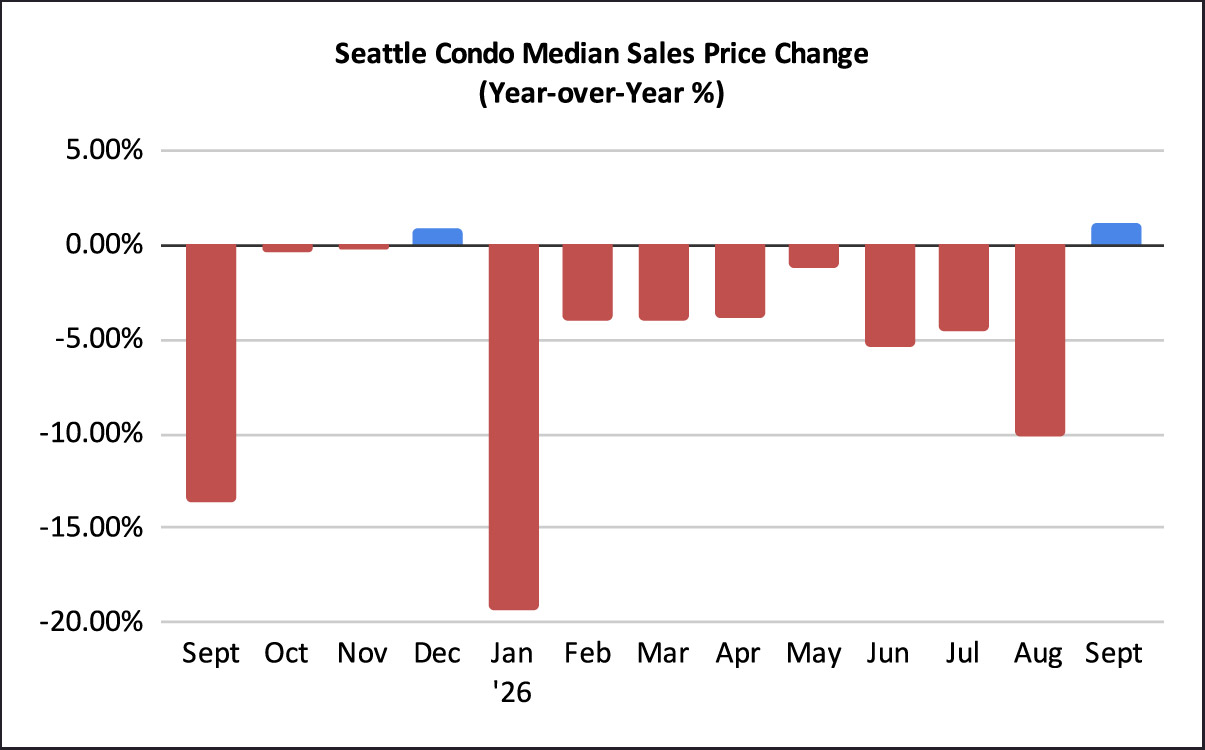
The Seattle citywide median sales price for condos was $530,000 in September. That reflected a year-over-year (YOY) increase of 1.2% and a month-over-month dip of 0.9%. This was only the second time this year that we experienced a YOY increase.
Looking at NWMLS neighborhood areas, several locales exhibited an increase in their median sales price for the month. These were Northwest Seattle (+36%), South Seattle (+32.3%), Capitol Hill / Central (+19.4%) and Northeast Seattle (+15.3%). Conversely, West Seattle (-20.1%) decreased as did Southeast Seattle (-20%), Downtown / Belltown (-16.3%) and Queen Anne / Magnolia (-6.7%). Click here to view the full neighborhood breakdown at the end of the post.
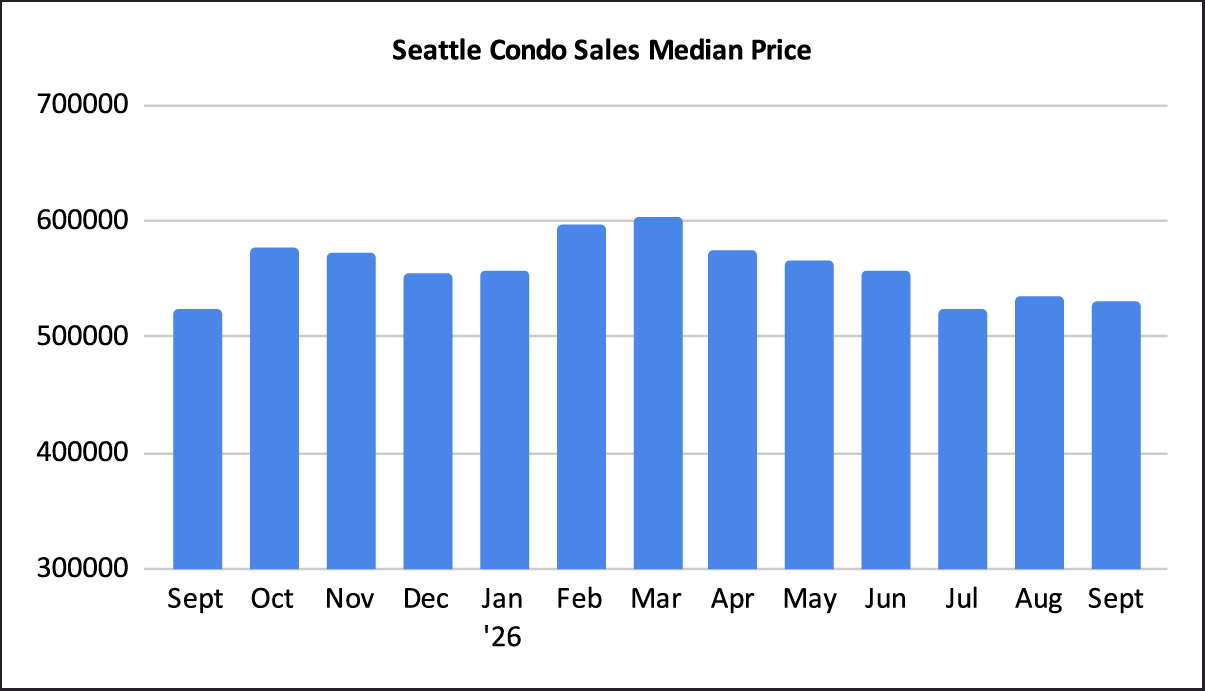
The above condo figures are from the NWMLS (Northwest MLS), which groups various property types under its condominium classification. The NWMLS’ broad condo definition include condoized single family houses, townhomes, accessory dwelling units (ADU), detached accessory dwelling units (DADU), houseboats, moorage and deeded parking spaces. Typically, these non-traditional condos are newer and higher valued and skew the condo statistics.
Last month, non-traditional condos constituted 27.6% of all Seattle condo sales with a median sales price of $685,000. That reflected a one-year and a one-month decrease of 8.3% and 5.9%, respectively.
Traditional condos, on the other hand, realized a year-over-year increase of 6.2% to $475,000 in September, which also equaled the median sales price in the prior month.
Seattle Condo Listings Grow
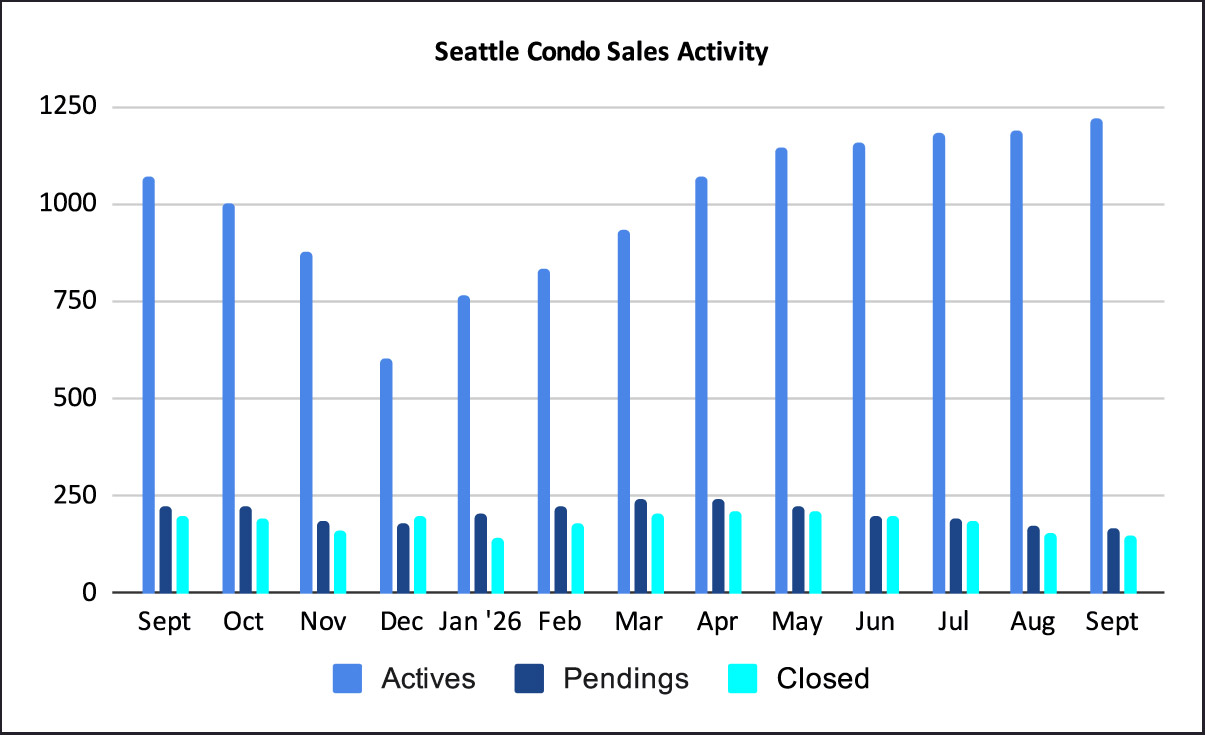
The number of Seattle condo properties for sale increased in September to 1,220 units. That’s 14.2% more than last September and 2.6% more than the previous month. We started the month with 1,189 units listed and sellers added another 493 properties for sale throughout the month for a total of 1,683 units. Of that amount 462 listings came off the market through sales, being expired or sellers canceling the listing, being rented out or for other reason. That left 1,220 at month’s end.
As a result of the increased inventory, combined with lower sales volume, the Seattle condo inventory supply increased to 7.3-months of supply. This officially moves Seattle into a buyer’s market environment. This is the first time since 2010 that Seattle’s condo market, as a whole, has reflected a buyer’s market.
That said, this may be short-lived. The Pacific Northwest’s housing marketing is seasonally cyclical and during the “big dark” Fall months the number of listings plummet. With the coming shorter days, overcast skies, rain and the busy holiday season, the real estate market lags with sellers and buyers taking a break.
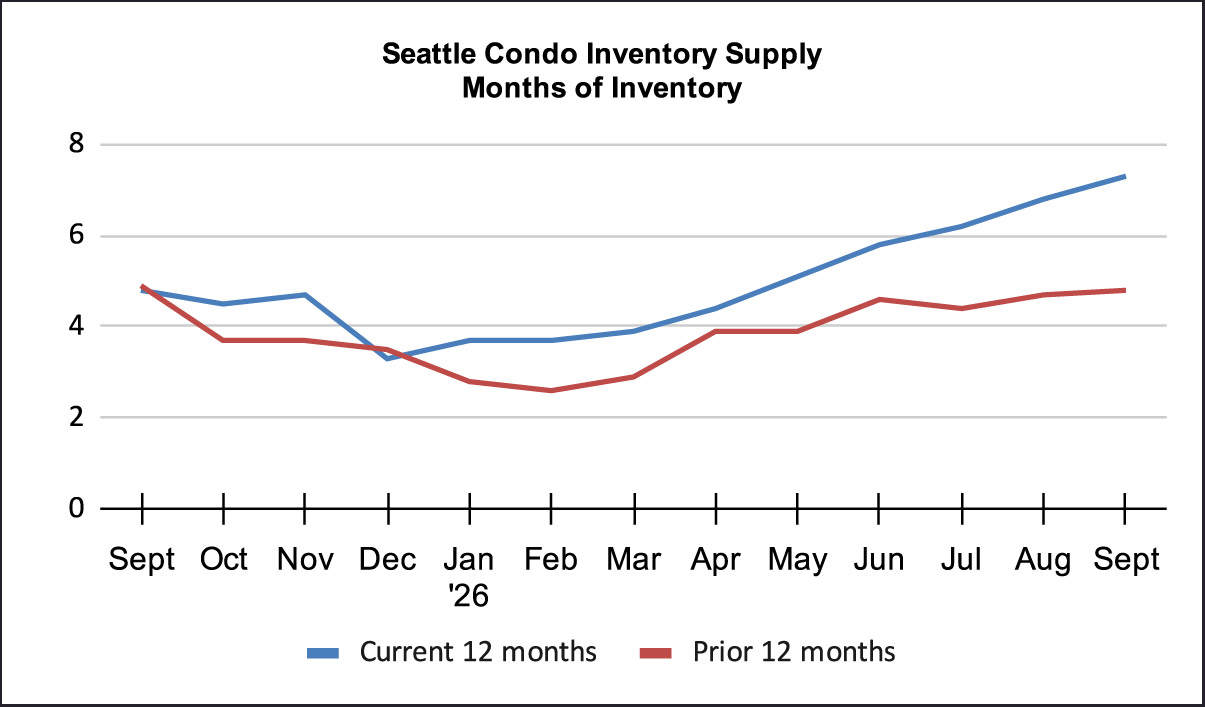
The inventory supply rate categorizes the current market environment. A rate of less than 4-month of supply is considered a seller’s market. A rate between 4 to 7-months is a normal or balanced market. And, a rate more than 7-months would be a buyer’s market. We calculate the supply rate using pending sales transactions.
Condo Sales Tumble
The number of pending sales significantly underperformed 2025 by 25.1% with 167 properties in pending transaction status (listed with accepted offers in escrow). That was also 4.6% fewer than from the previous month.
Rising mortgage interest rates, employment instability in the Seattle area (especially the technology sector), buyer fatigue, inflation, fluctuating investment account balances, the election and global issues all have an impact on the local housing market. And, presently, it’s an adverse impact.
Seasonality also plays a role with the market lagging through the remainder of the year.
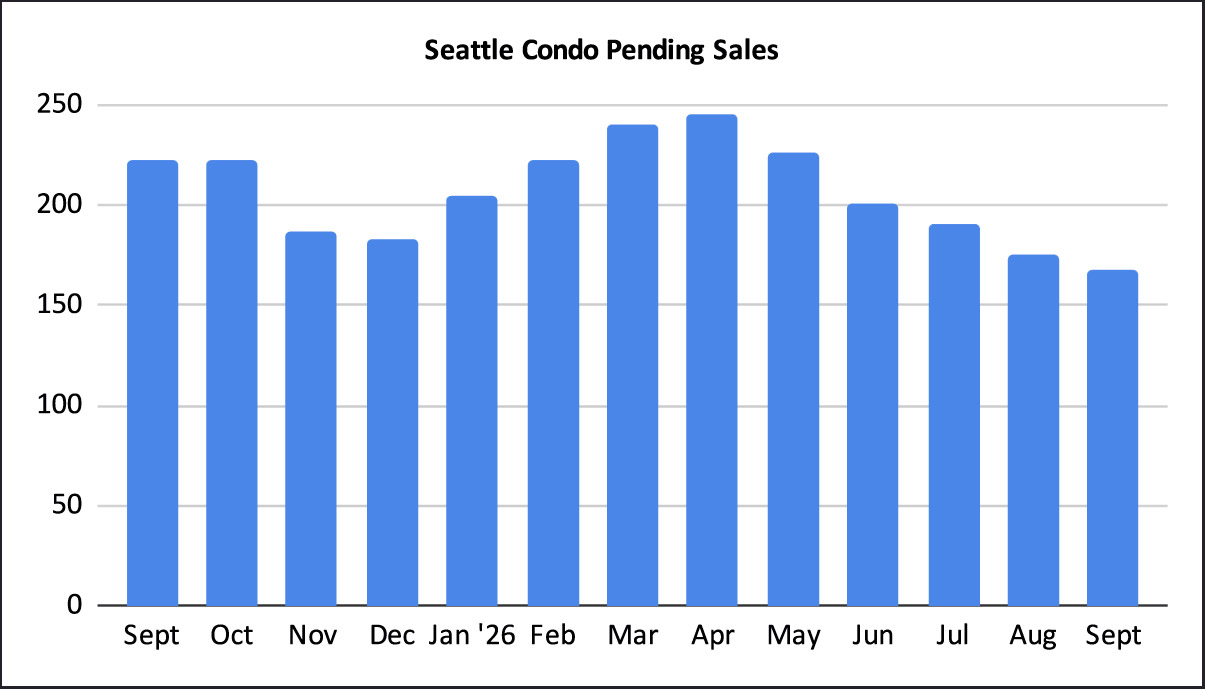
Condo closings follow pendings by a month or so, thus with falling sales volume we’ll experience fewer closings. Last month there were 147 closed sales, representing a one-year and one-month decrease of 25% and 3.9%, respectively.
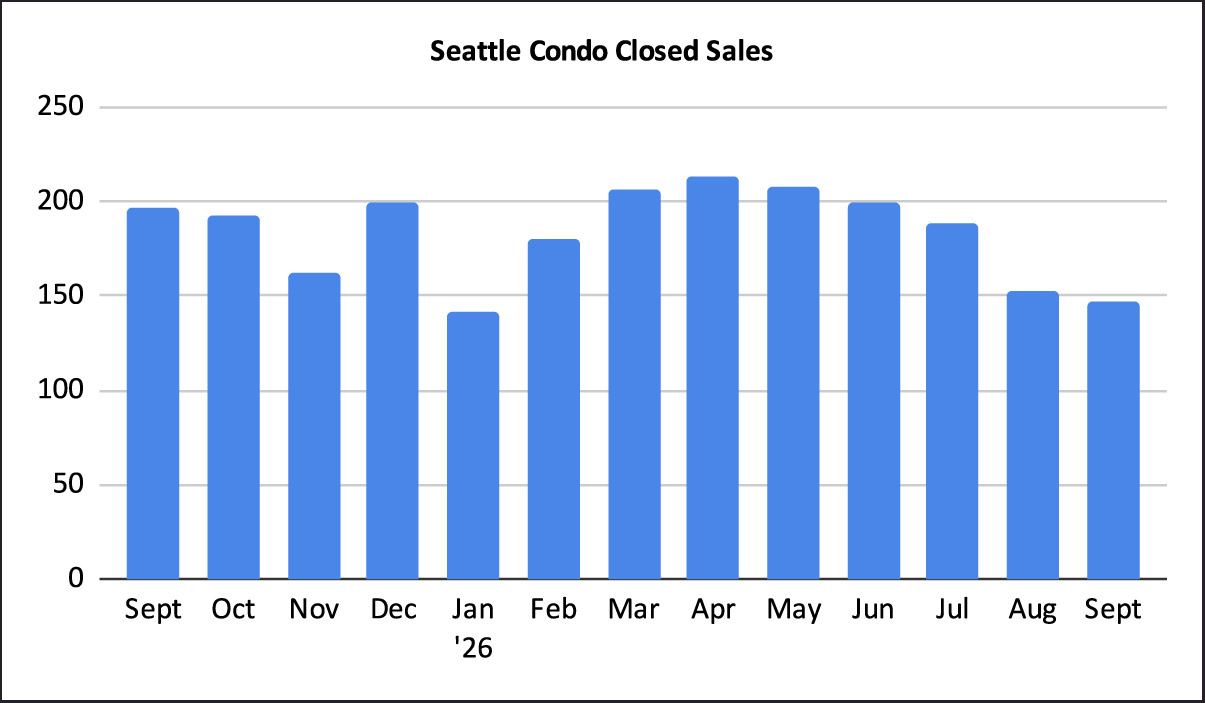
In summary
Historically, the second half of the year exhibits a slowing real estate market in Seattle and the Pacific Northwest. This year is no exception, however, the current market is vastly underperforming 2025 levels in terms of unit sales and selling prices.
That’s particularly true when contemplating the condo market as a whole with non-traditional properties such as single family houses, townhomes, ADUs and DADUs skewing the statistics. Looking at just the traditional condos – a single unit in a multi-unit building – the market faired a little better in September. Traditional condos exhibited a year-over-year median sales price increase of 6.2% for the month.
Going forward through the remainder of the year not much will change. The Fall season is the slowest for the Seattle real estate market and we’ll experience fewer listings, reduced sales activity and lower selling prices.
For buyers, the current abundance of listings provide exceptional choices and opportunities along with stronger buyer offer positioning. Sellers don’t want to sell during the “big dark” unless they have to, giving buyers an advantage.
For sellers, unless circumstances doesn’t allow for it, it is optimal to hold off listing until the new year. Like clockwork the market takes off in late January through to Spring. The final months of the year provides an opportunity to make any necessary maintenance updates and repairs to the property ahead of the busy Spring season.
Seattle Condo Market Statistics September 2026
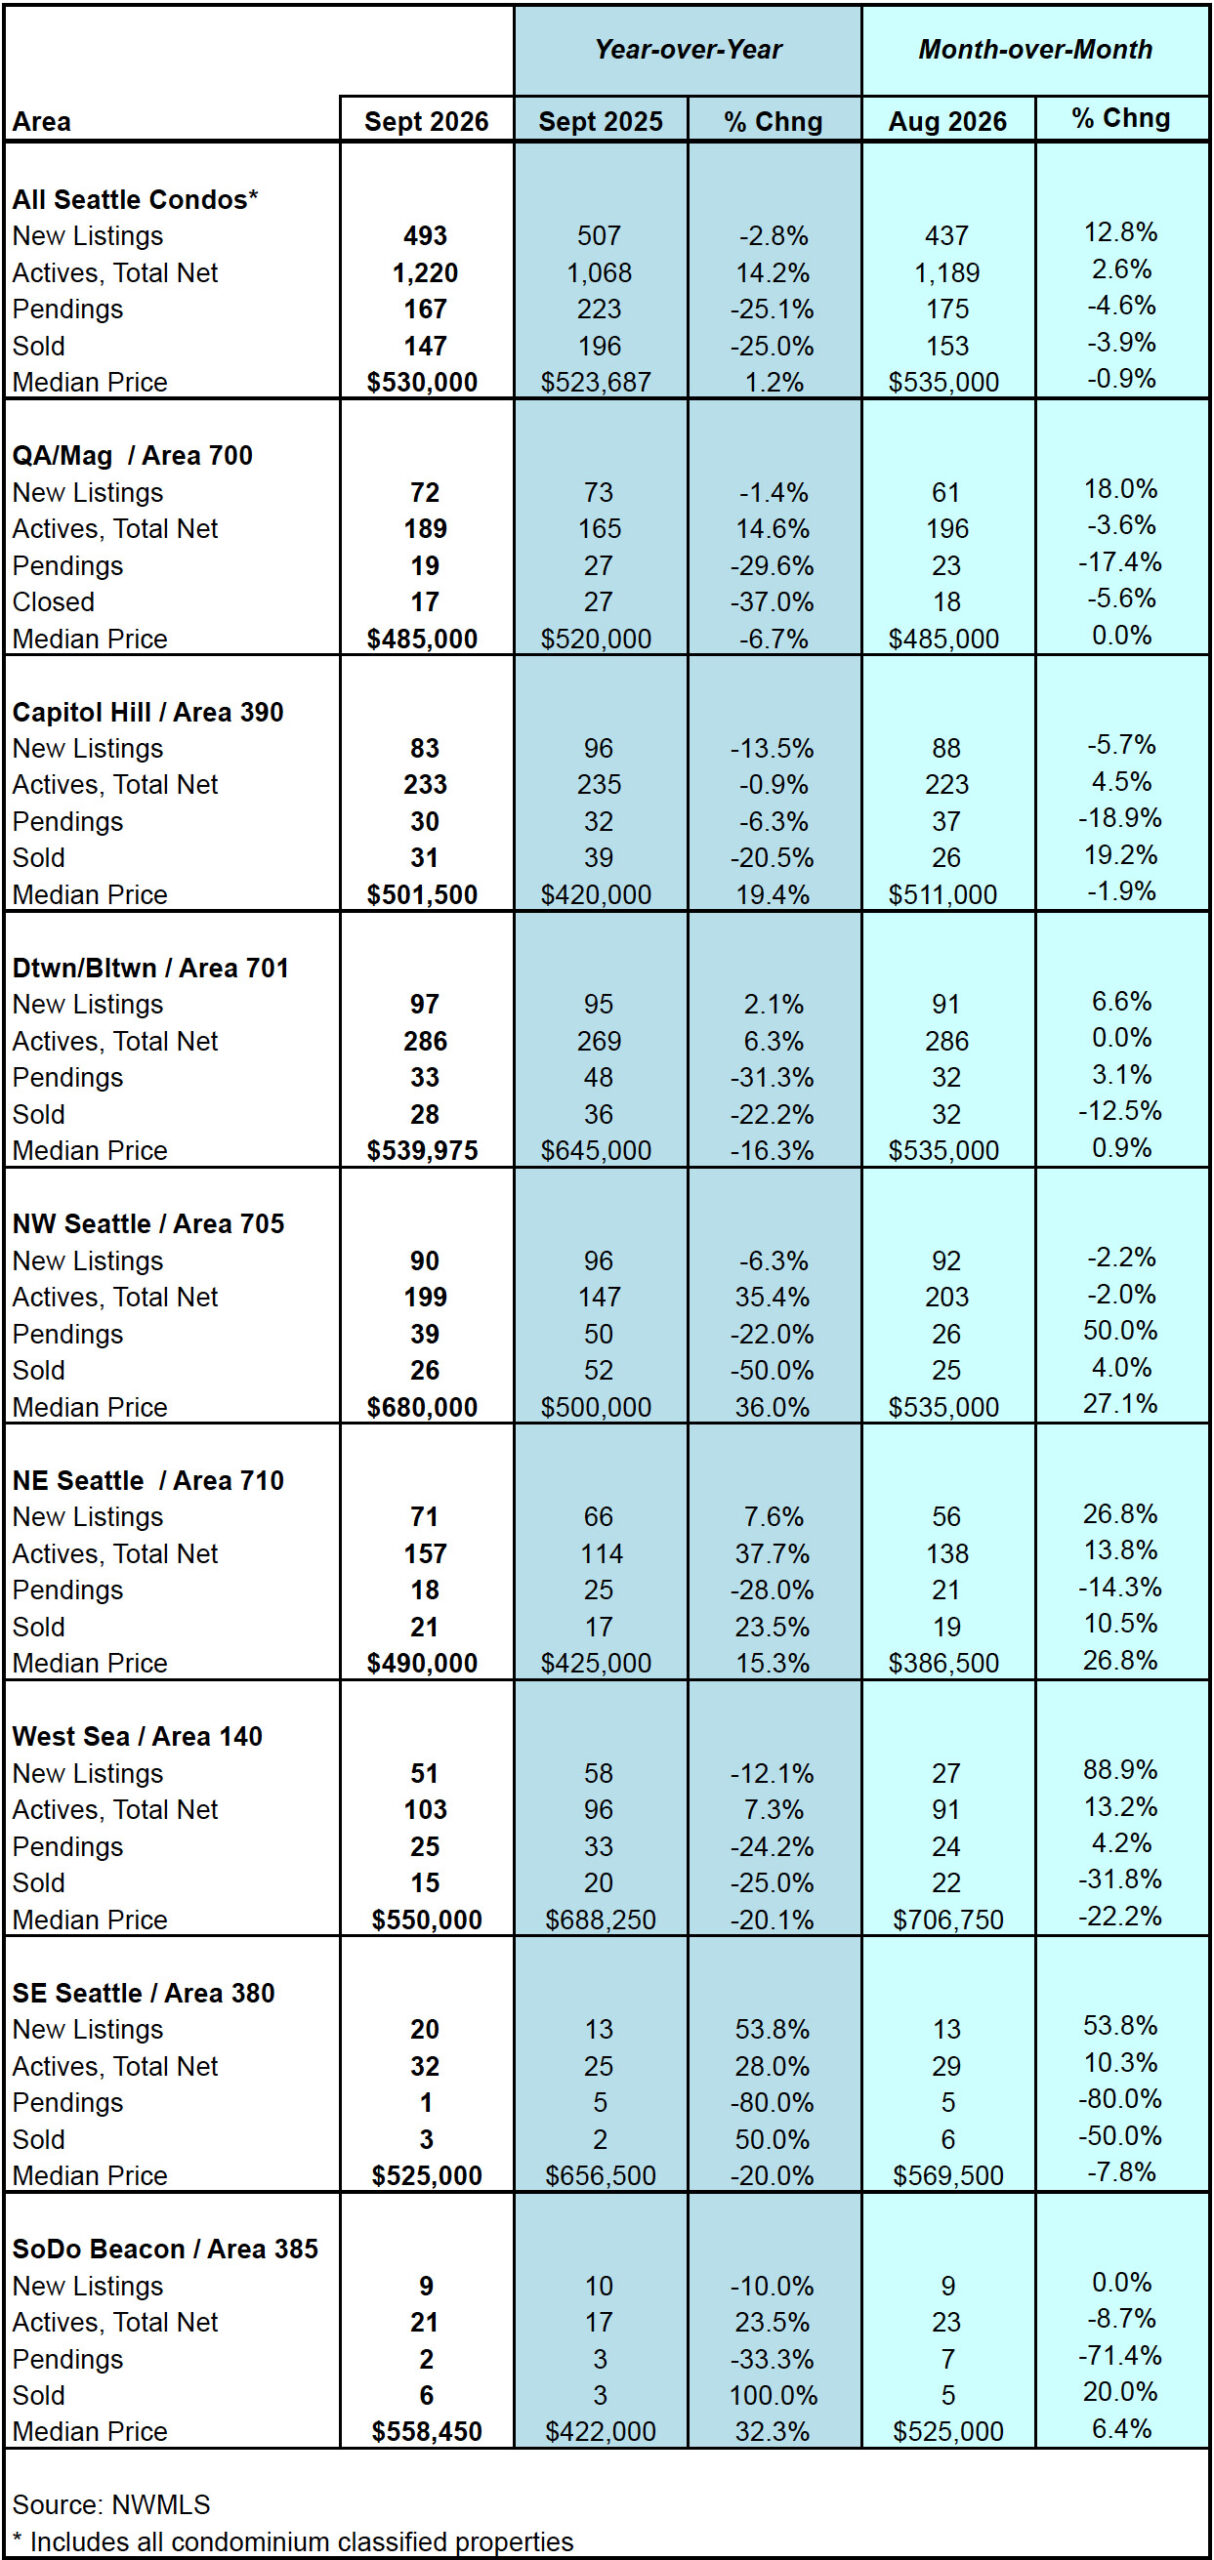
Source: Northwest Multiple Listing Service. Some figures were independently compiled by Seattle Condos And Lofts and were not published by the NWMLS.
© SeattleCondosAndLofts.com