Seattle Condo September 2025 Market Report

Seattle’s condominium market was a bit of a mix bag in September. On the positive side, unit condo sales increased. On the other hand, inventory continued to rise and median sales prices fell.
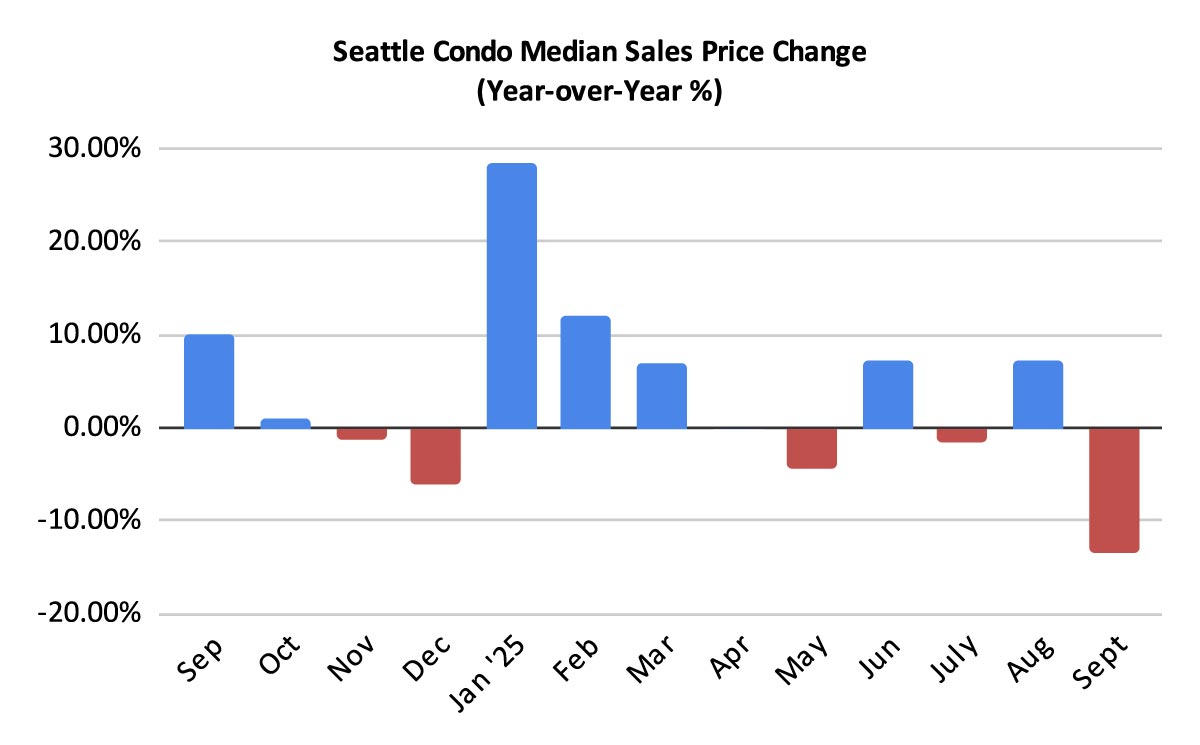
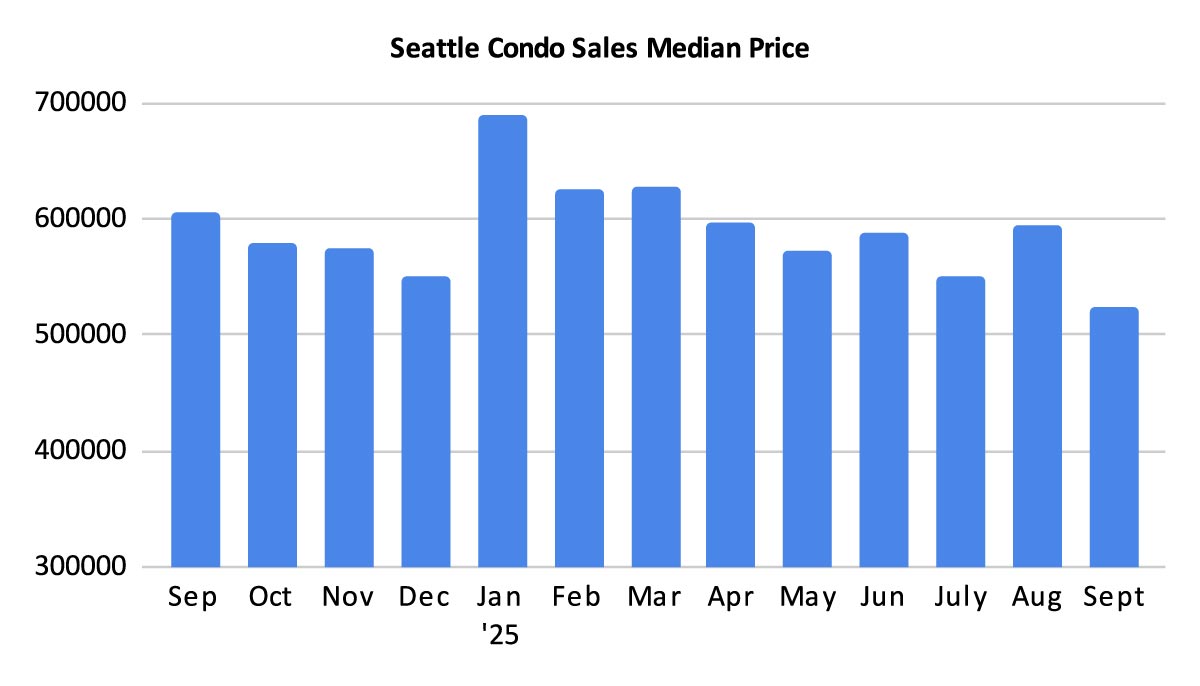
Seattle Condo Selling Prices Dip
The Seattle citywide median sales price for condominiums in September was $523,687. That reflected both a year-over-year, and month-over-month decrease, of 13.6% and 12%, respectively. Notably, Capitol Hill / Central (-30.5%), Northeast Seattle (-30.3%) and Northwest Seattle (-10.3%) and West Seattle (-5.7%), exhibited year-over-year declines.
However, several areas experienced increases to their median selling prices. Queen Anne / Magnolia increased 6.8% and downtown increased 1.6% compared to last September. Southeast Seattle exhibited a 67.3% jump, but that’s a sample size of 2 units and both were townhomes compared to a single condo unit last year. View the complete result at the end of the post.
The figures noted above reflect all “condominium” sales in the city of Seattle. The Northwest MLS, unfortunately, has a broad definition of condominiums that include properties that we don’t typically think of as condos. These non-traditional properties include townhomes, attached accessory dwelling units (ADUs), detached accessory dwelling units (DADUs), condoized single family houses, deeded parking spaces, moorage and houseboats.
Generally, these are newer, larger and higher-valued than the traditional condo unit in a multi-unit building or complex. Most condos in Seattle are smaller, comprised of studios, one-bedrooms or two-bedroom units.
Looking at just non-traditional condos, they comprised 21.7% of the condo sales in September with a median sales price of $747,000. That exhibited a one-year decrease of 9.5% and a one-month drop of 6.5%. As a percentage of condo sales, there were fewer non-traditional condo sales compared to last year when they accounted for 28.7% of all condo sales.
For regular, traditional condos, their citywide median sales price in September was $447,000. That reflected a one-year and a one-month decline of 14.9% and 15.7%, respectively.
Inventory Grew…Slightly
Not too surprisingly the number of active Seattle condos listed for sale increased. Seattle’s real estate market is cyclical and follows the same trend every year. We typically see a bump in the market between the end of Summer and the start of the Fall holiday season.
Seattle ended the month with 1,068 properties for sale, representing a year-over-year increase of 13.9% and a one-month rise of 6.8% over August.
In terms of newly added inventory in September – we started the month with 1,000 units and sellers added 507 new listings throughout the month for a total of 1,507 properties. Of that total, 439 units came off the market through a combination of sales, had expired or been cancelled, were rented out instead or other reasons. That resulted in 1,068 active listings at month end, which was just 68 more than what we started with.
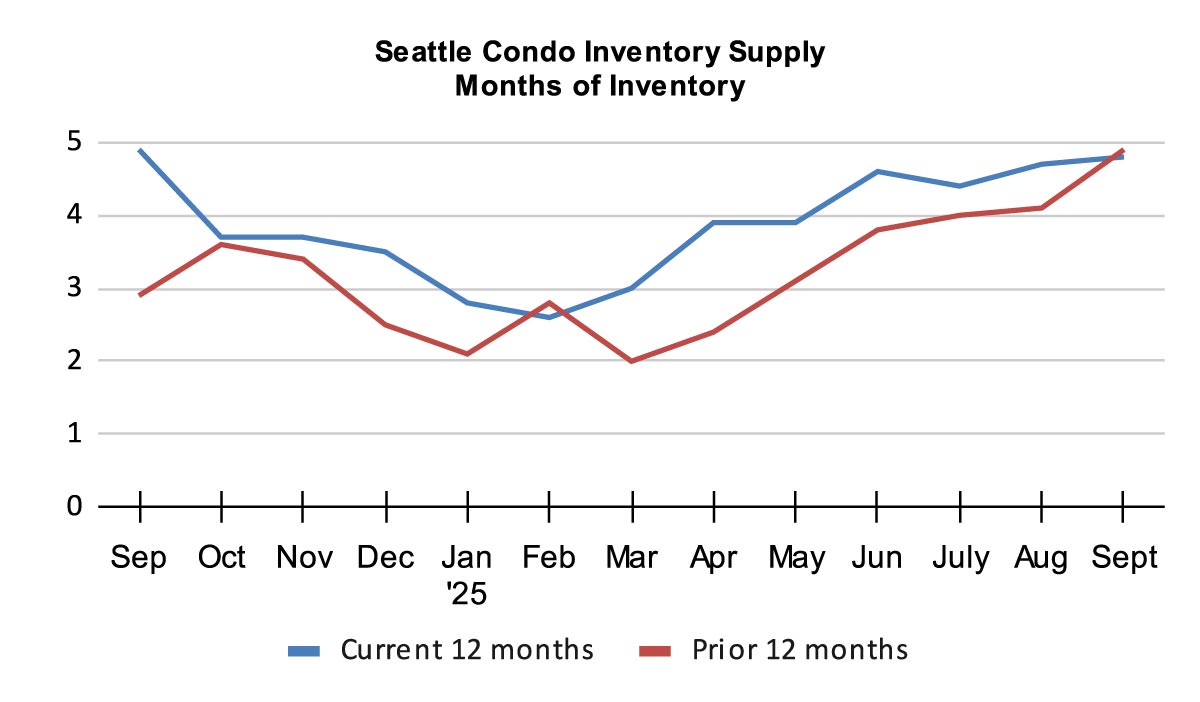
As a result of the absorption in September, the monthly inventory supply rate rose slightly from 4.7 to 4.8-months of supply. And, that’s lower than where we were at a year ago, barely.
We calculate the supply rate based on the number of pending sales transactions to listings. The result is the number of months it will take at the current rate of sales to absorb the existing inventory supply. This metric characterizes the real estate market environment.
A rate of less than 4-months of supply is considered a seller’s market, while a rate from 4 to 7-months of supply is a balanced or normal real estate market. And, a rate greater than 7-months of supply would be a buyer’s market.
As a whole, Seattle’s condominium market is in a balanced market environment. That said, Seattle is comprised of neighborhood and price-level micro-markets. For instance, both Northwest Seattle and West Seattle had inventory supply rates under 3-months. That places them in a seller’s market environment.
By comparison, single family houses had a supply rate of 2.8-months. House buyers have encountered a more competitive housing market than condo buyers.
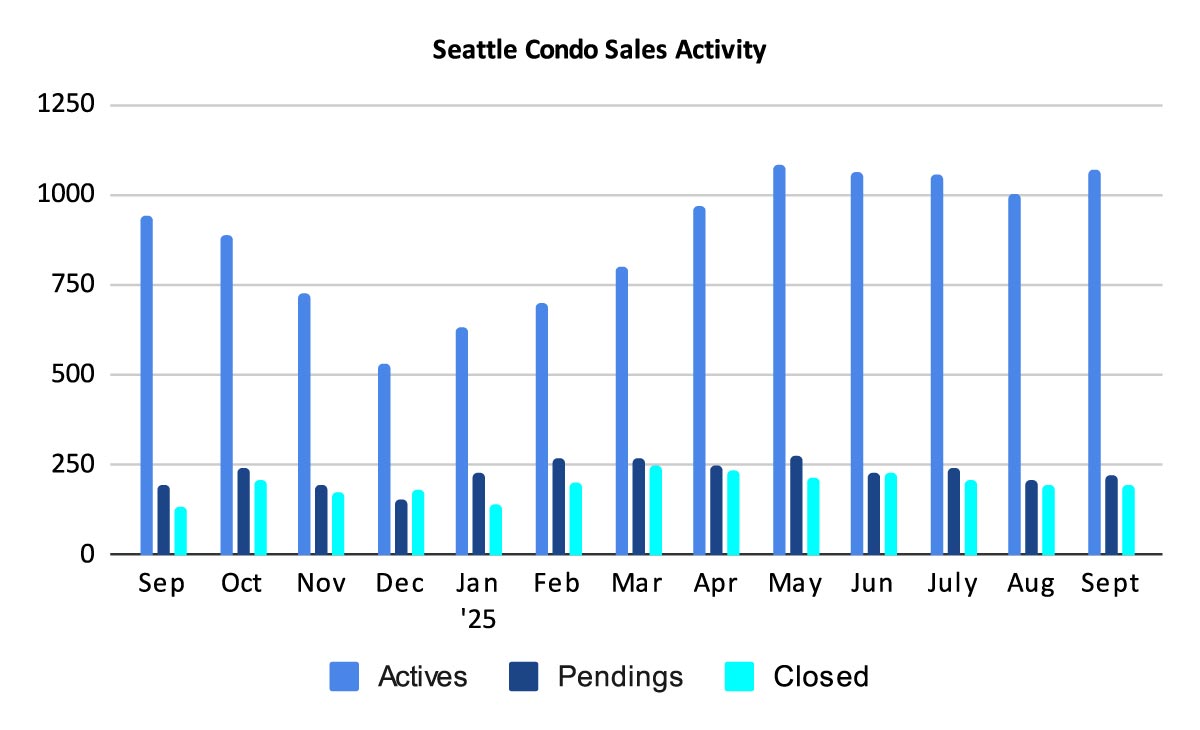
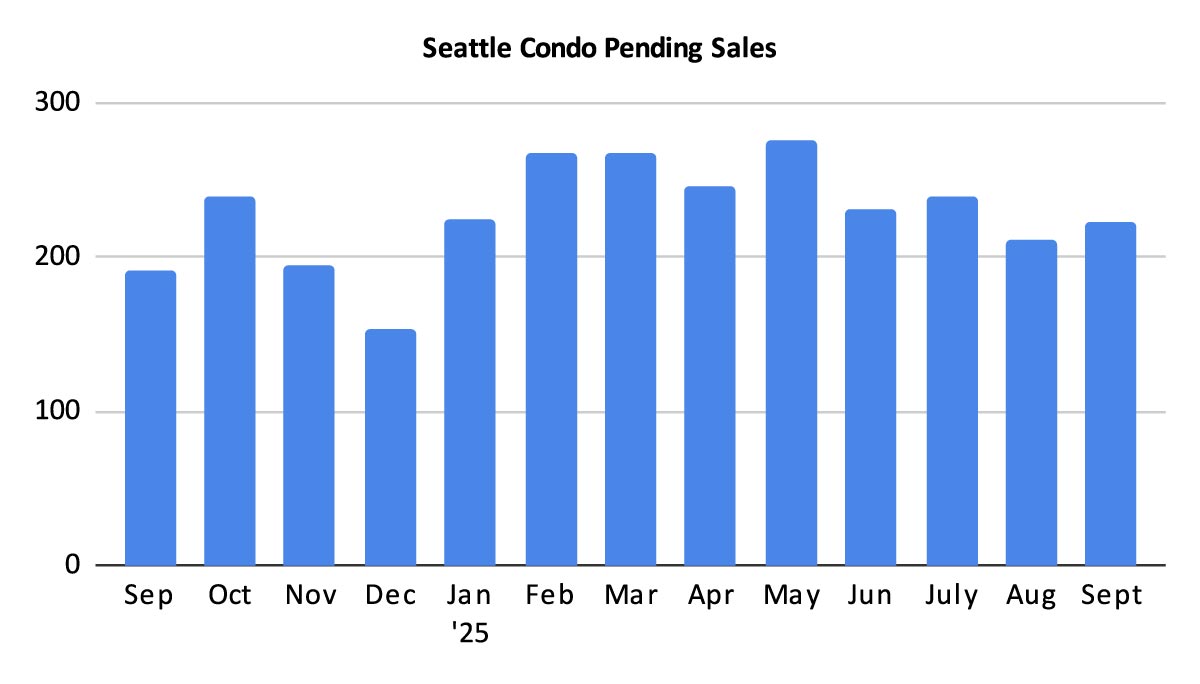
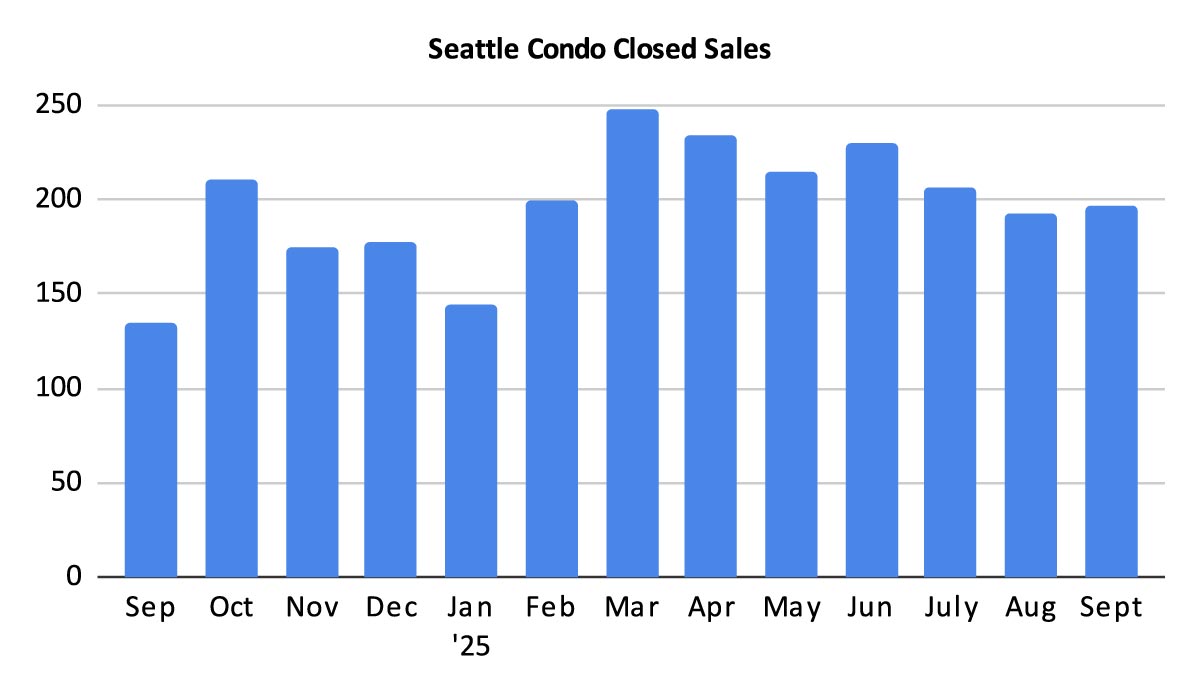
End of Summer Bump in Sales
The cyclical end of Summer bump resulted in an increase of condo sales with 223 units going under contract into pending sales status. That was 16.7% more pending units than a year ago and 5.7% more than the prior month. We may see this continue in October before trailing off for the remainder of the year.
Buyers may have been encouraged by the brief drop in mortgage rates, more choices and a stronger negotiating position.
The number of closed condo sales also rose in September with 196 units, which was 45.2% more than the same period last year. And, slightly more by 1.6% over August.
In Summary
Depending on your point of view Seattle had either solid or a softening condo market results in September. The market was relatively active and condo sales increased, which kept the inventory supply on an even basis with the previous month. Buyers were buying. On the other hand, median sales prices were tempered, though there were a few pockets of strong selling prices.
That said, we are now at the tail end of the year and Seattle’s real estate market follows a cyclical, seasonal flow. The weather change, shorter daylight and the busy holiday season all hamper the marketplace, which slows down through the remainder of the year.
Even so, there are condo sellers who need to sell and savvy buyers who are keen to take advantage of the softer market.
Seattle Condo Market Statistics September 2025
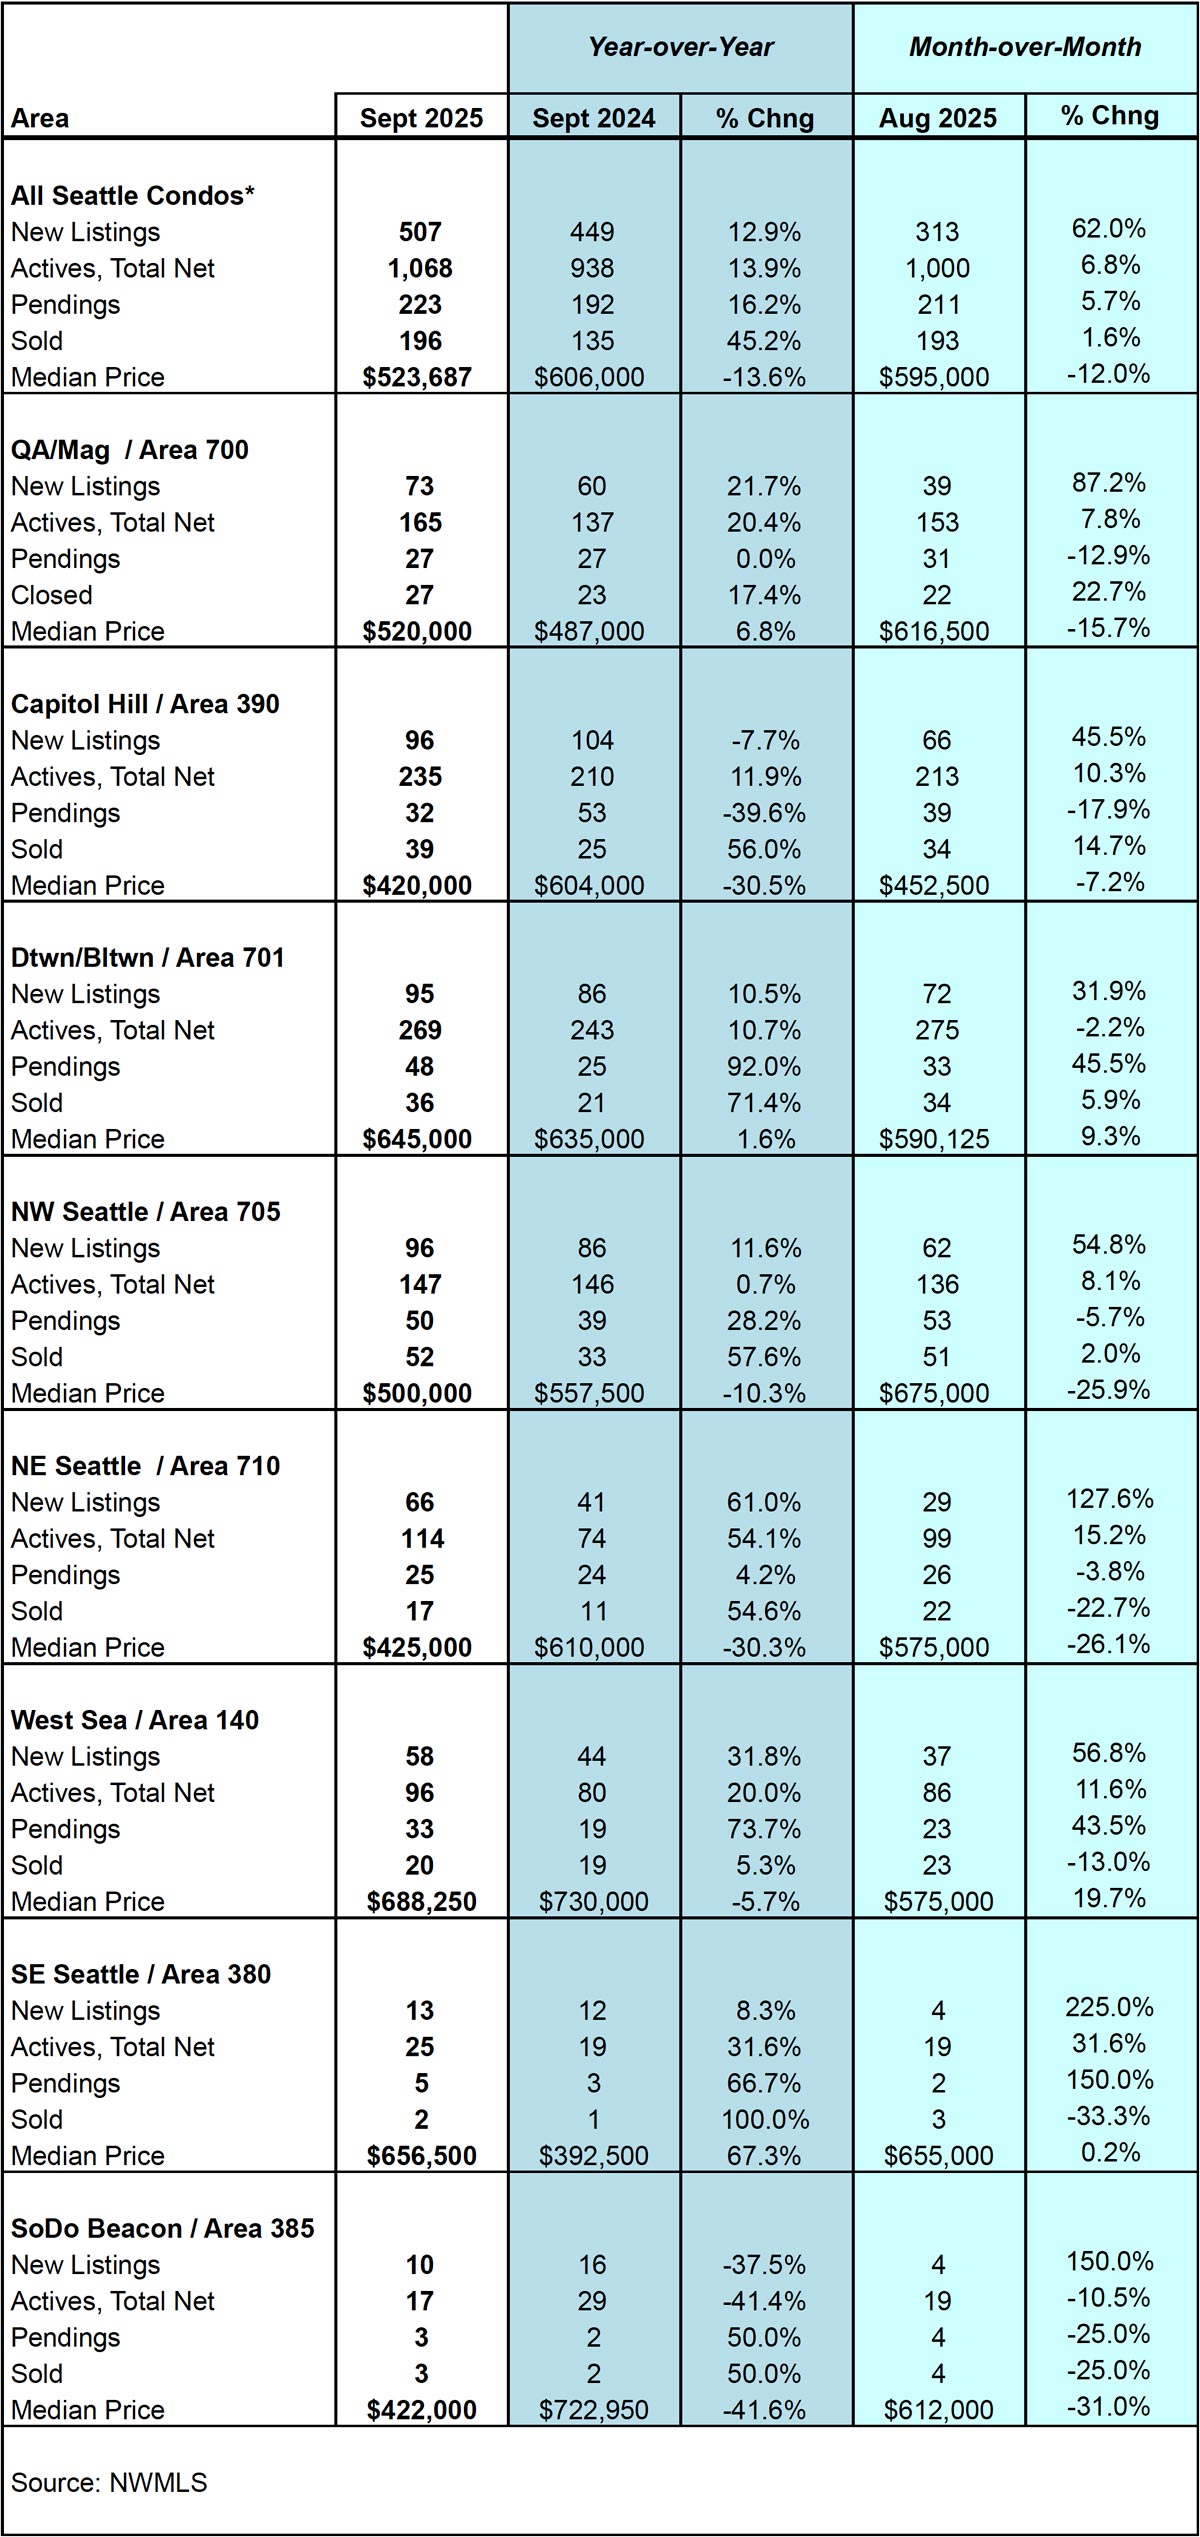
Source: Northwest Multiple Listing Service. Some figures were independently compiled by Seattle Condos And Lofts and were not published by the NWMLS.
© SeattleCondosAndLofts.com