Seattle Condo Market August 2025 Recap

Seattle’s condominium market ended Summer on a positive note. The August market results exhibited a rise in median selling prices, condo unit sales and inventory.
Selling Prices Tick Upwards
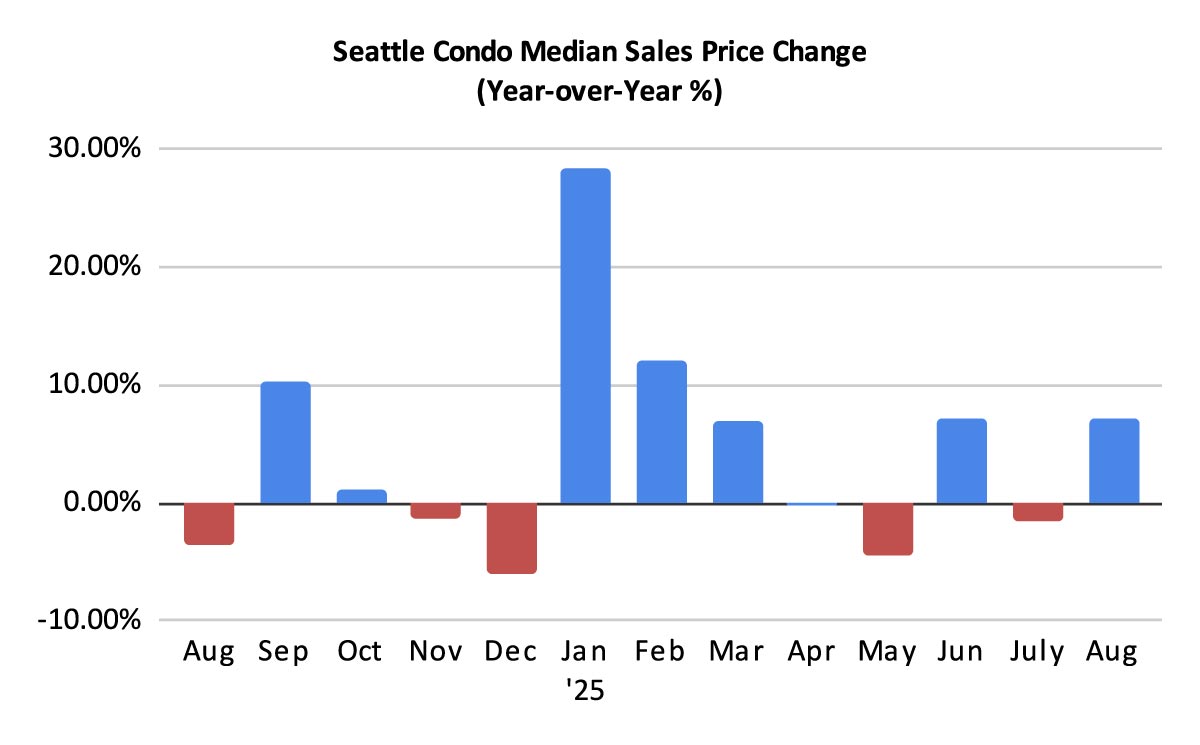
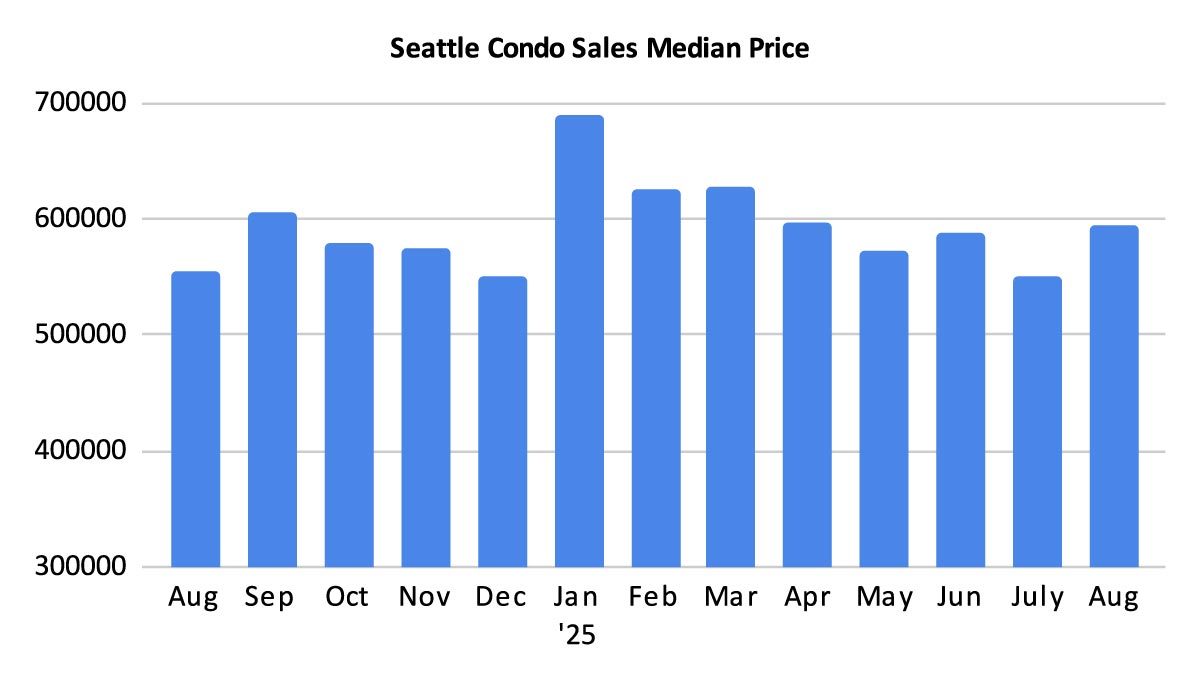
The Seattle citywide condo median sales price was $595,000 last month, reflecting a year-over-year (YoY) and a month-over-month increase of 7.2% and 8.2%, respectively. Looking at NWMLS neighborhood areas, most of the city experienced YoY increases, except for the condo-dense areas.
Northwest Seattle (+26.2%), West Seattle (+11.7%) and Northeast Seattle (+4.6%) lead the way. On the other hand, Capitol Hill (-12.6%), Downtown/Belltown (-7.2%) and Queen Anne/Magnolia (-0.3%) experienced decreases. That’s not too surprising since they collectively had 64.1% of the active condo listings in Seattle last month. View the complete neighborhood area breakdown at the end of the post here.
But, these figures are not exactly what they seem. Unfortunately, the NWMLS condo statistics are a bit skewed given the way the NWMLS classifies “condominium”. Previously, condos were comprised of individually owned single units/flats in a multi-unit building or complex. What we typically think of as traditional condos.
However, with the condomization and explosion of various housing types, the NWMLS has explanded the condominium classification. It now includes non-traditional condos such as townhomes, accessory dwelling units (ADUs), detached accessory dwelling units (DADUs), single family houses, house boats and moorage.
Non-traditional condos are typically newer, larger and higher priced than traditional condo units. In August, they accounted for 27.5% of all condo sales compared to only 17% a year ago. And, they had a median sales price of $799,000.
Excluding non-traditional condos, then the median sales price for typical, traditional condos in August was $530,000. That’s still a decent YoY increase of 6.3% and a whopping 24.7% rise over July 2025.
Northwest Seattle Example
Diving a bit deeper, let’s take a look at Northwest Seattle with its $675,000 median sales price, and had clocked in the highest YoY change of 26.2% for August. Like the citywide figures, the number of non-traditional property sales increased, here from 45% to 54% of all properties sold, and had a median sales price of $809,950. That was a 1.4% increase compared to the same period last year.
Traditional condos on the other hand reflected fewer sales, down from 55% to 46% of all condo sales. And, had a $417,000 median sales price, which reflected a 1.3% YoY decrease from last August. That’s just over $250,000 below the overall median of all “condos” for the area.
If you’re buying or selling a traditional condo at a typical condo building like Canal Station or Hjarta in Ballard, then the market is more volatile and much less robust than the published statistics may indicate.
More Listings, But At A Declining Rate
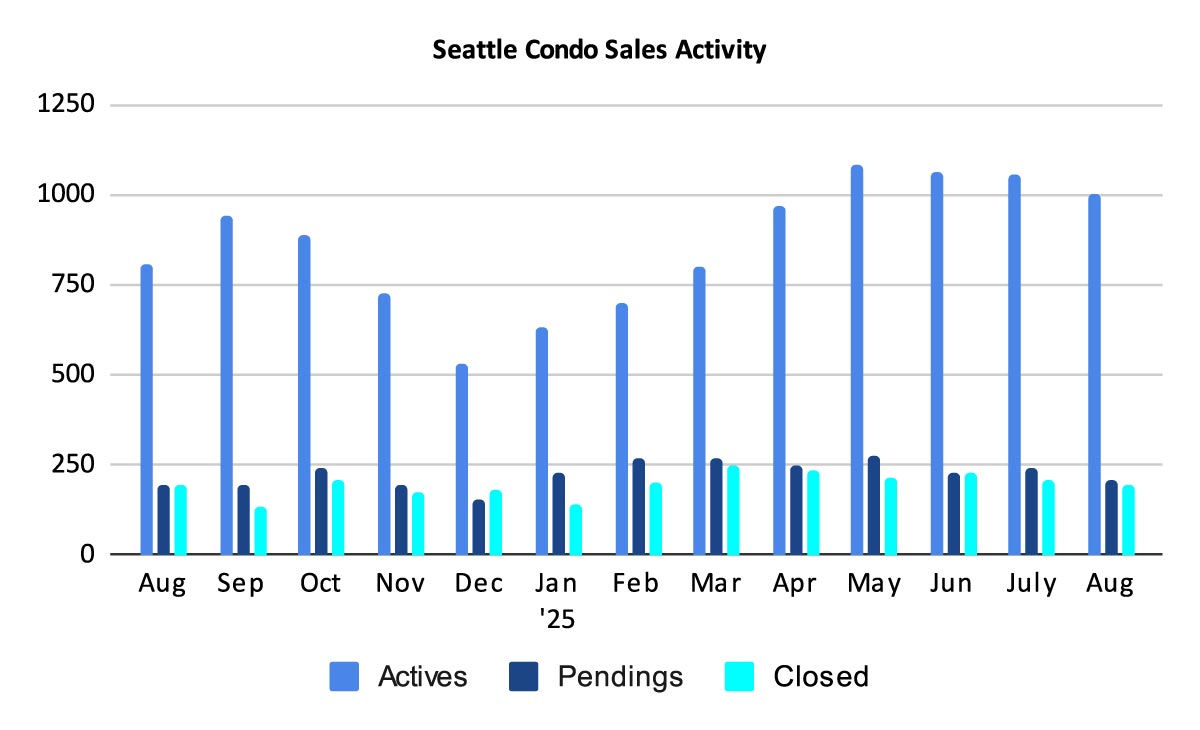
There were 1,000 active condo listings for sale at month end, reflecting an increase 23.6% YoY and a 5.3% dip compared to the prior month.
We started August with 1,056 listings and sellers added another 313 units for sale throughout the month for a total of 1,369 units. Of that number, 369 came off the market due to sales (e.g. pendings and closings), were expired or cancelled, rented or were temporarily taken off market.
Interestingly, the number of new listings coming to market slowed with 313 units in August. That’s 2.2% fewer compared to the same period last year and 23.8% fewer than the previous month. However, this is likely to increase in September as we historically experience a post-Summer bump in listings and sales. After that, listings will plunge through the remainder of the year.
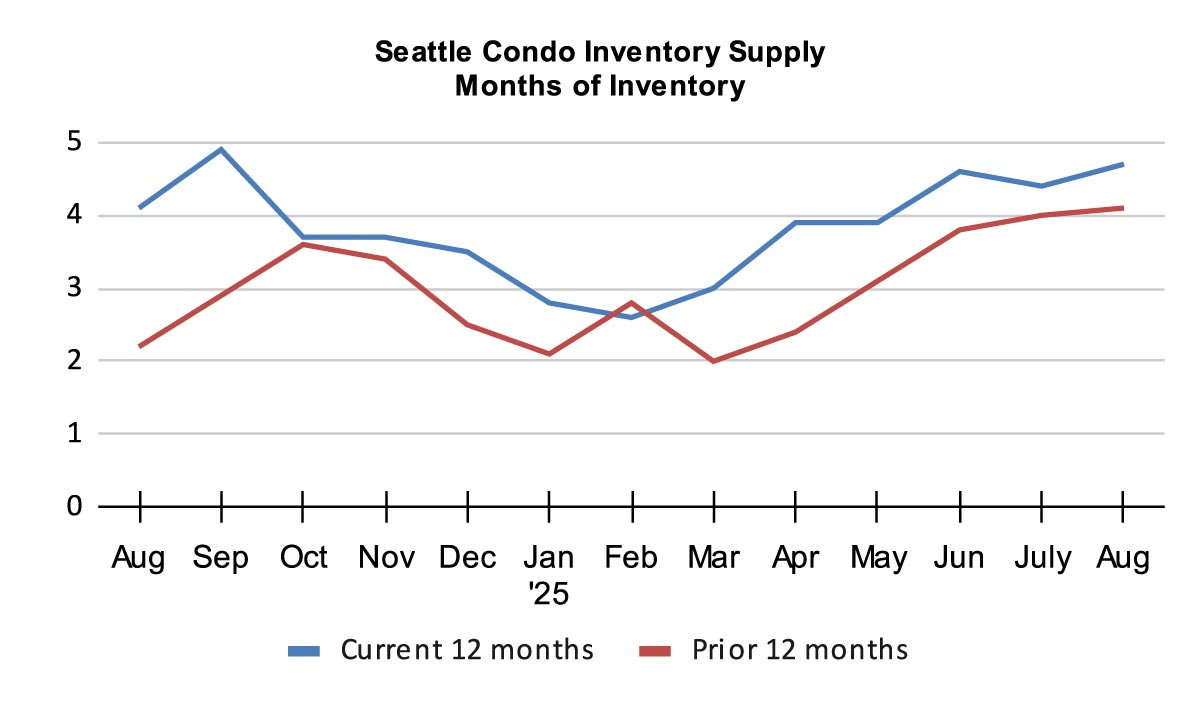
The inventory supply rate edge upwards slightly to 4.7-months of supply due to fewer unit sales in August.
The inventory supply rate is a metric that classifies the current state of the real estate market. A rate of less than 4-months of supply is characterized as a seller’s market. A rate between 4 to 7-months is a balanced or normal market. And, a rate over 7-months is considered a buyer’s market.
With that said, buyers and sellers will encounter differing conditions based on their location and price points with Seattle’s real estate micro-markets. For example, North Seattle currently reflects a seller’s market with less than 4-months of supply, while downtown is an entrenched buyer’s market with over 8-months of supply.
Condos Sales Were Steady
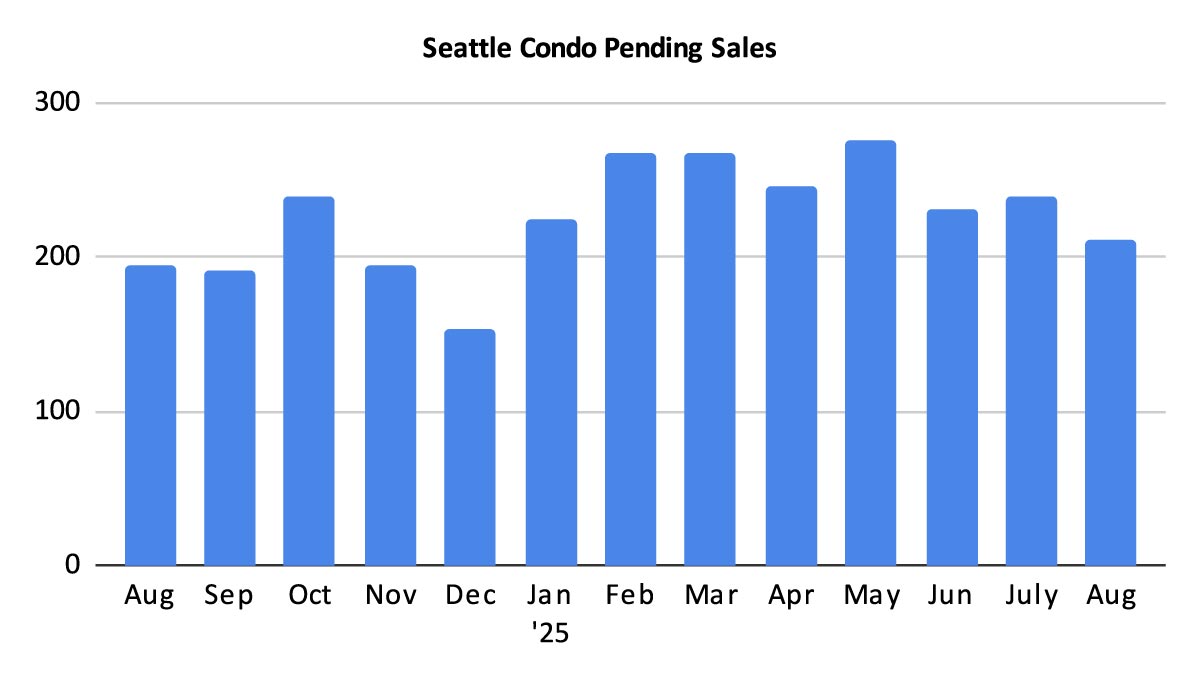
There were 211 pending sales transactions – accepted offers in escrow – in August. This exhibited a year-over-year bump of 8.2%, but a dip of 12.1% from the prior month. The condo market had a more robust month compared to sales activity last year. We will likely see a September / October bump before the market cools off for the Fall holiday season.
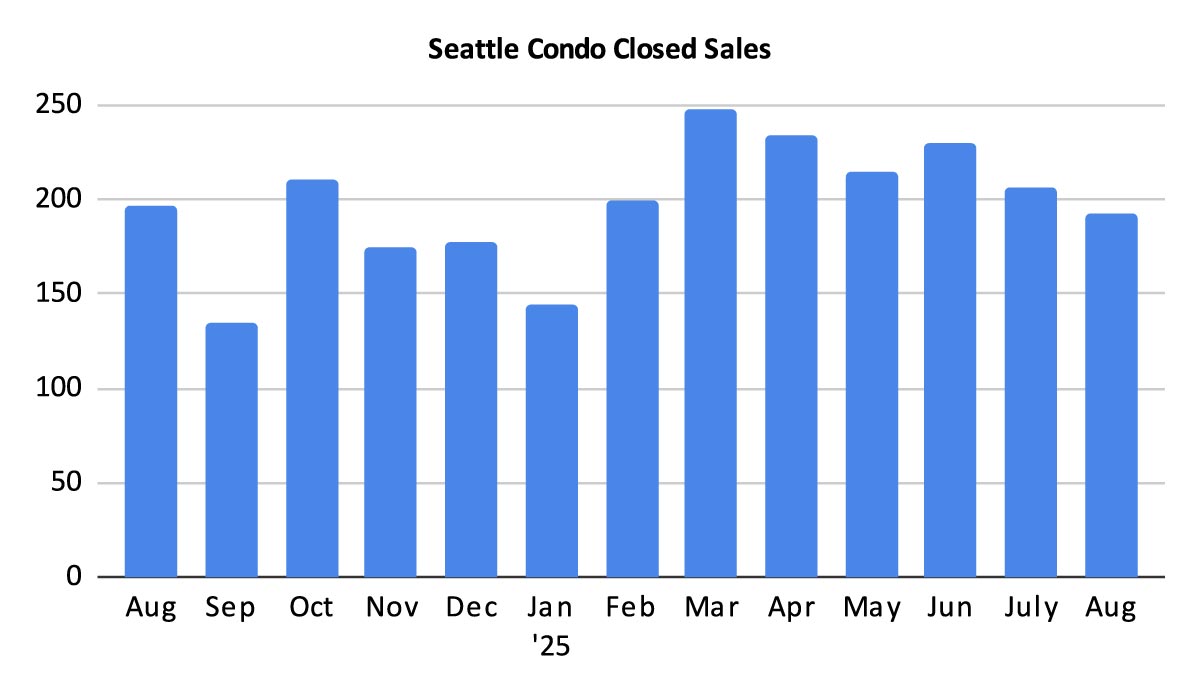
The number of closings were lower with 193 units. That’s 1.5% and 6.8% fewer compared to last August and the previous month, respectively. Given the number of pendings in July and August, we may see closings increase with the September figures.
In Summary
The Seattle condo market ended summer on a positive note. Overall, median selling prices and unit sales activity outperformed August 2024 levels.
But, much of that was due to the sale of non-traditional condos such as townhomes, detached accessory dwelling units (DADUs) and condoized single family houses. Most of these are newer, and larger, high-end properties with premium prices that drove up the median sales price.
The market overall is holding steady in a balanced, normal market environment. Though, as a city comprised of housing micro-markets, buyers and sellers will experience a range from a seller’s market to a buyer’s market depending on locale and price points.
Seattle follows a cyclical, seasonal real estate pattern. With the close of Summer the market will slow through the remainder of the year. Though, we typically experience a last hurrah of sorts with a September/October boost before the Fall holiday season.
Seattle Condo Market Statistics August 2025
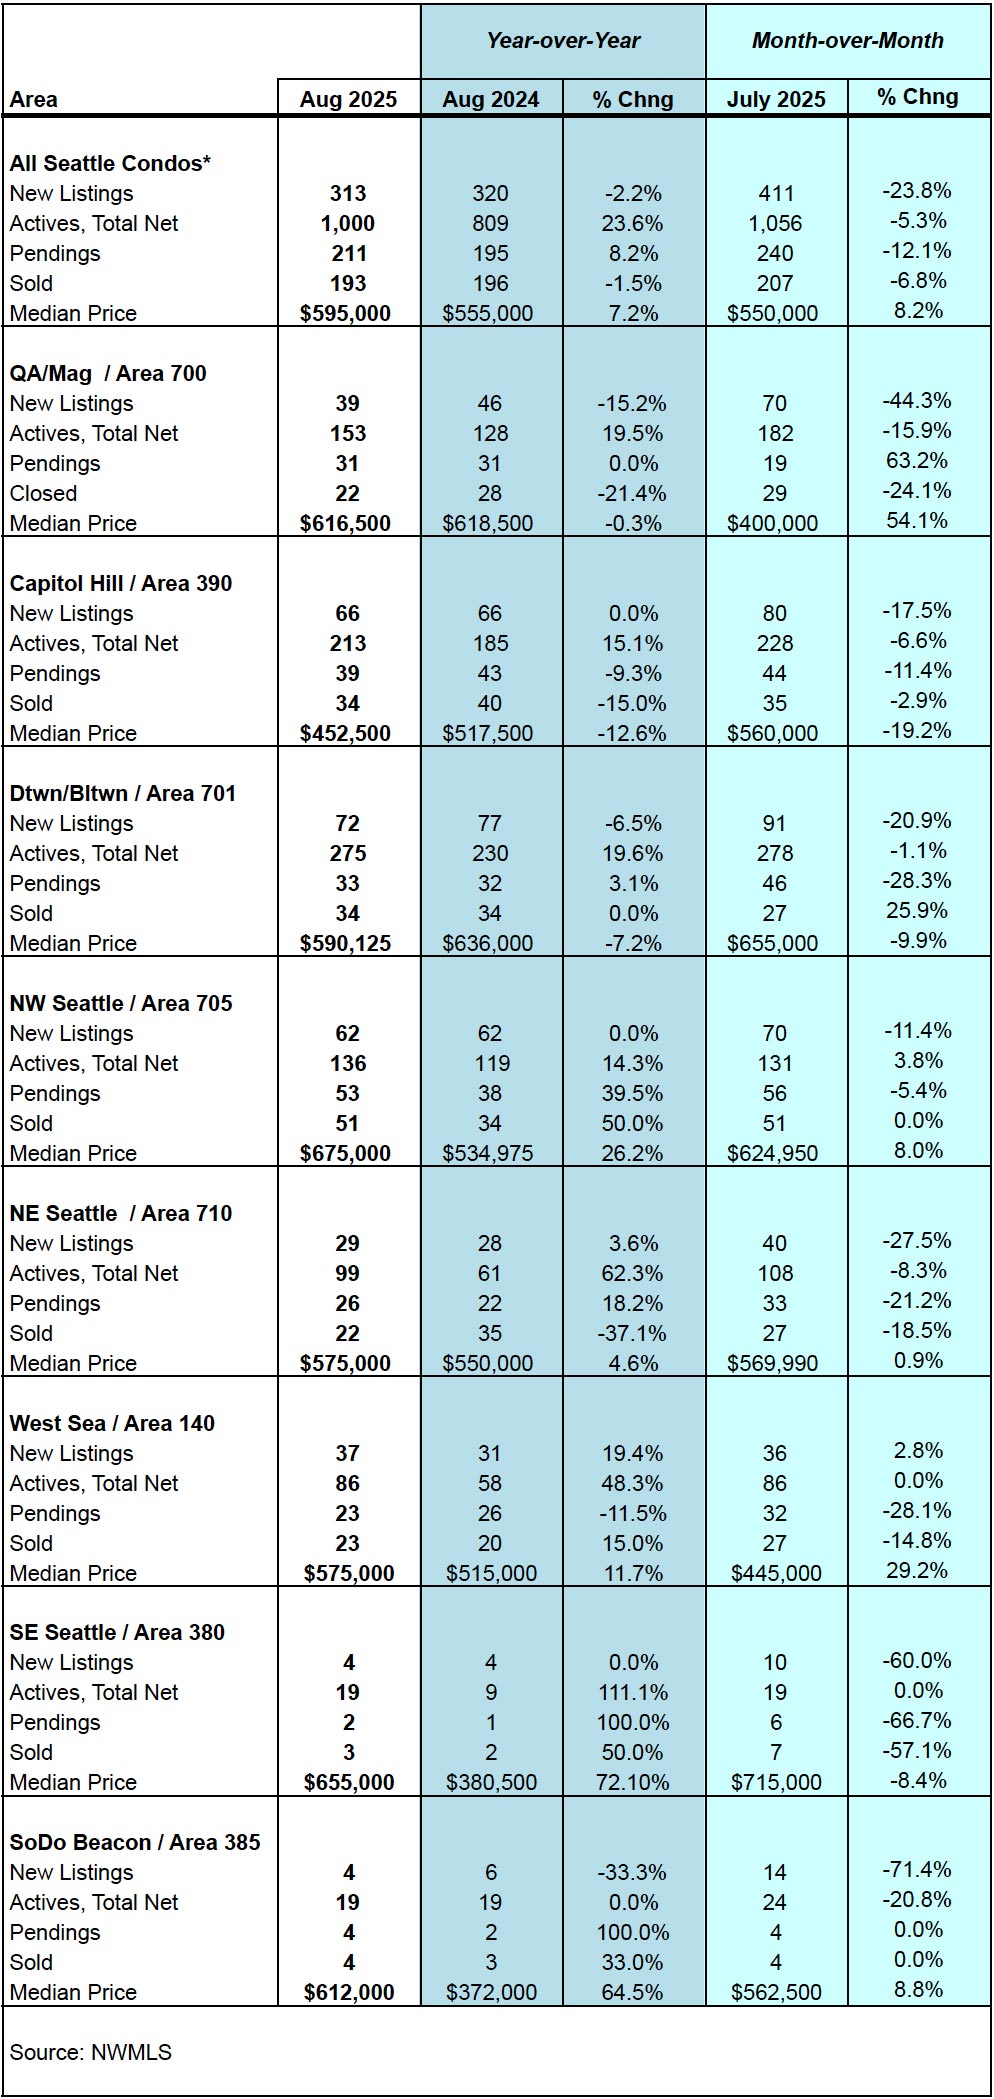
Source: Northwest Multiple Listing Service. Some figures were independently compiled by Seattle Condos And Lofts and were not published by the NWMLS.
© SeattleCondosAndLofts.com