Seattle Condo Recap March 2025

March was a solid month for Seattle’s condominium market with inventory, unit sales and selling prices on the upswing. Or, not. There’s a caveat to March statistics, which I’ll get to later.
Condo Sales Prices Remain at a Premium
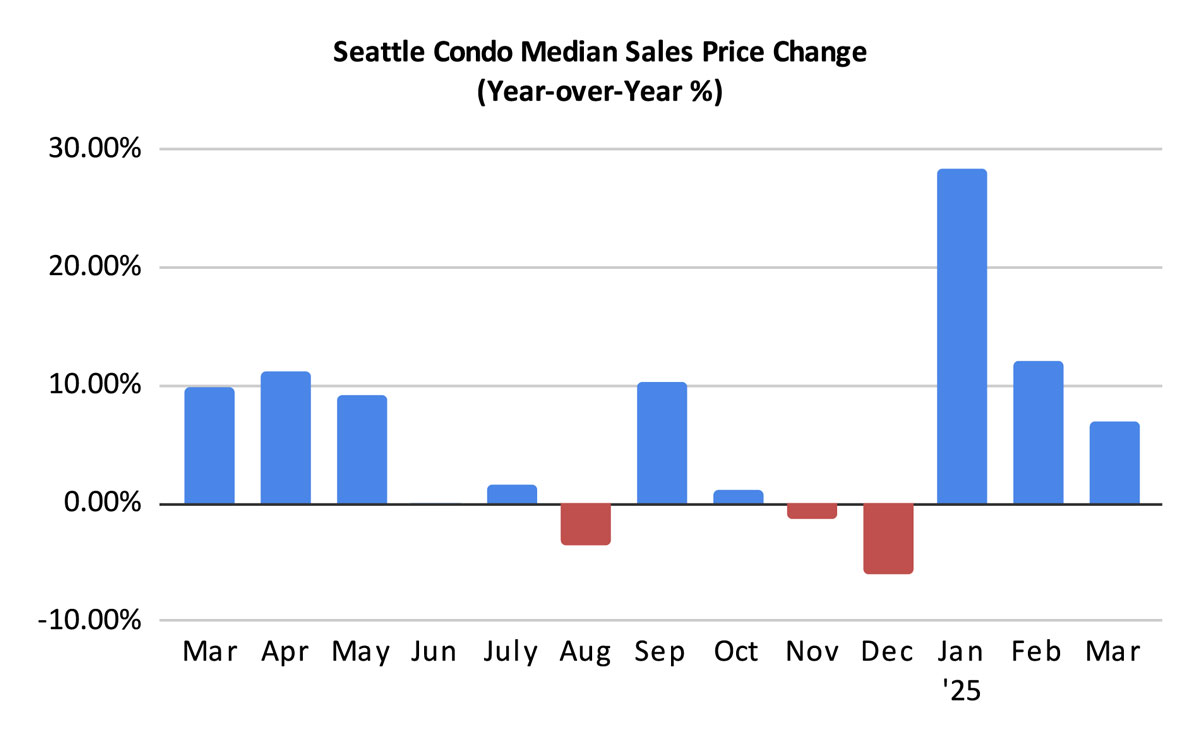
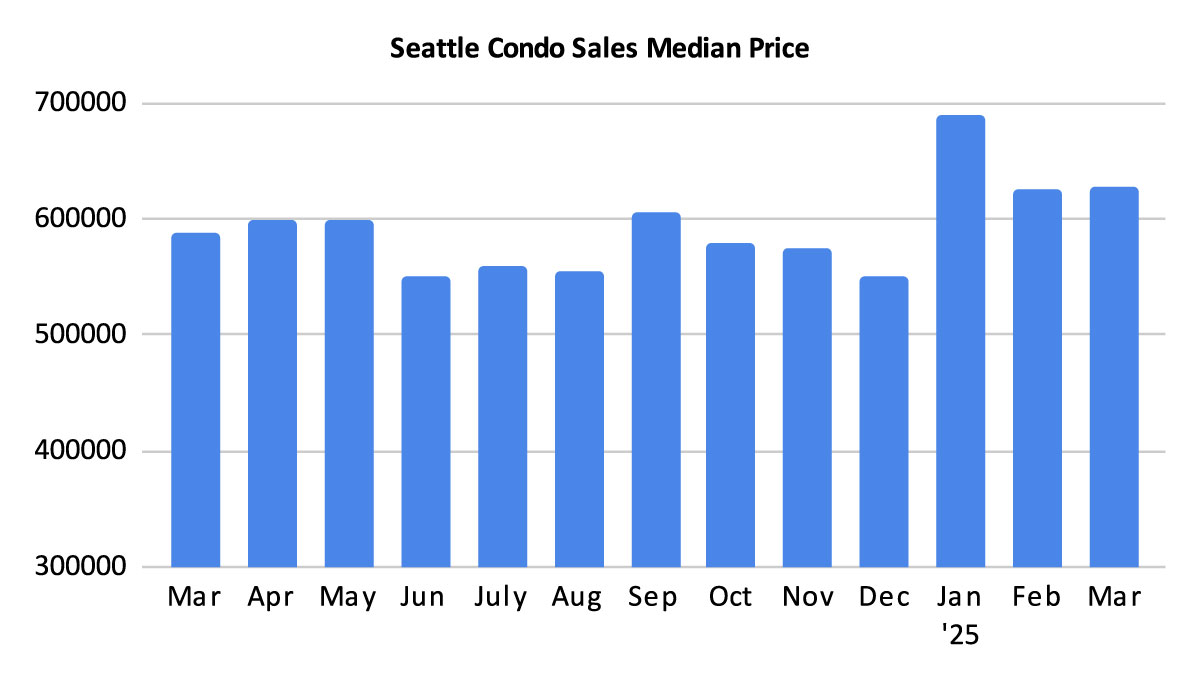
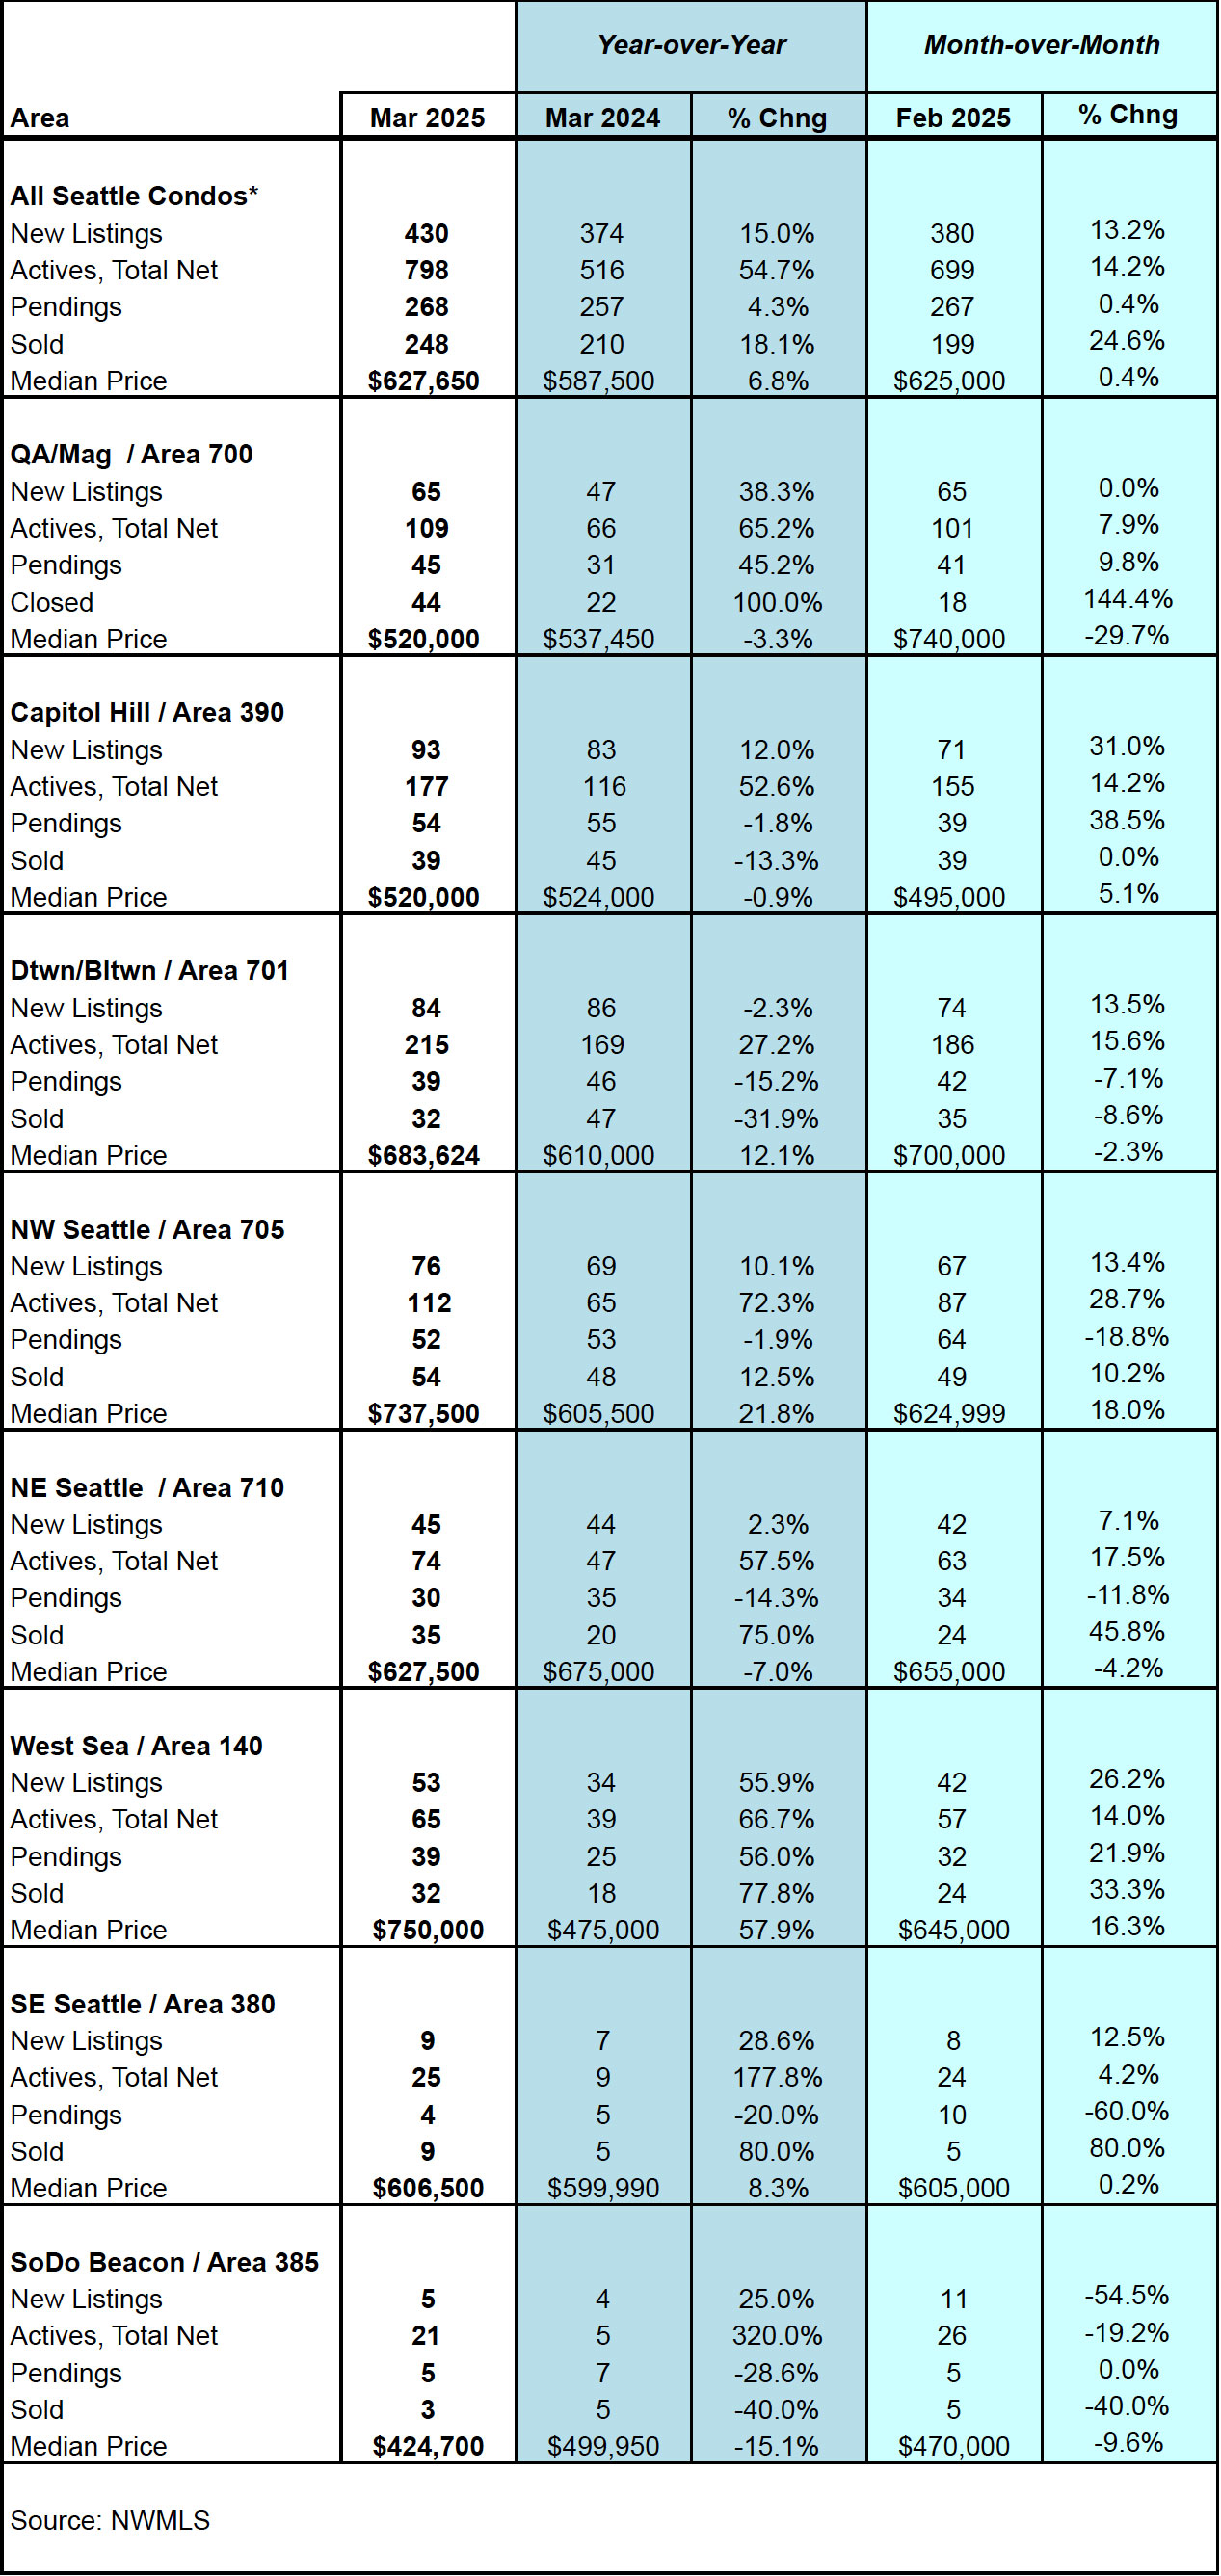
Based on the Northwest Multiple Listing Service (NWMLS’) published condominium classification stats for March, the Seattle citywide median sales price was $627,650. That is the second highest on record and represented a year-over-year (YOY) and month-over-month increase of 6.8% and 0.4%, respectively.
That was buoyed by sales of higher valued properties in the Downtown / Belltown (+12.1%), Northwest Seattle (+21.8%) and West Seattle (+57.9%) areas. Conversely, several areas reflected a decrease in their median selling prices in March – Queen Anne / Magnolia (-3.3%), Capitol Hill (-0.9%) and Northeast Seattle (-7%). See complete NWMLS neighborhood stat results here.
These neighborhood results track closely with a big caveat related to the NWMLS’ condominium statistics. The “Condominum” property type is an umbrella category that encompasses traditional condo units (a unit in a building or complex), plus many non-traditional condo properties. Non-traditional properties include townhomes, condoized single family houses, accessory dwelling units (ADU), detached accessory dwelling units (DADU), boat moorage and floating homes.
In March, these non-traditional condo properties accounted for 33.1% of all condo sales in Seattle, that’s nearly 1 in 3. They are typically brand new and much higher valued than a traditional condo unit. Given zoning laws, most of these have been constructed in North Seattle, West Seattle and Southeast Seattle, which tracks with their increases in median selling prices for the month.
If we excluded these, then the Seattle citywide median sales price for regular, traditional condos in March would have been $485,000. And, more surprising, the median sales price of traditional condos decreased year-over-year by 9.3% last month.
That’s a big swing when looking at the stats – from a 6.8% YOY increase for all condo types to a 9.3% decrease for traditional condo units.
Let’s take a closer look at one neighborhood area, NWMLS Area 705. This is Northwest Seattle – west of I-5 from the ship canal to the city limit at 145th St. When taking into account all condo property types, the area reflected a 21.8% YOY increase in its median sales price to $737,500 in March. In looking at just traditional condo units, there would have been a YOY decrease of 7.4% from $459,000 in March 2024 to $425,000 in March 2025.
Listings Continue to Rise
The number of condo listings increased as anticipated as we move into the peak season for real estate sales activity.
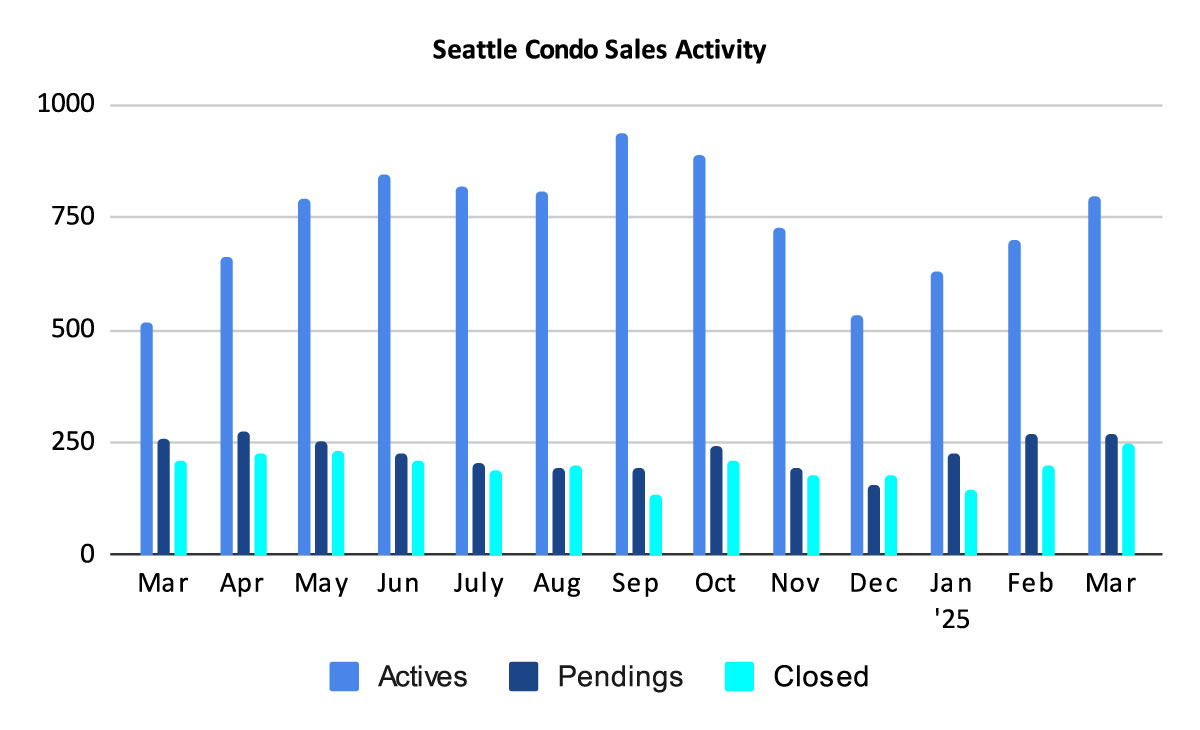
Seattle ended March with 798 active listings, which reflected a one-year increase of 54.7% over last March and 14.2% more listing than the prior month.
Breaking it down further – we started the month with 699 listings and sellers added another 430 listings for a total of 1,129 condo listing available for sale in March. Of that number, 331 came off the market for various reasons, such as going pending under contract. Or, those listings may have expired, been cancelled, been rented or were temporarily taken off the market, resulting in 798 at month end.
In terms of new listing added during March, there was a 15% increase compared to March of last year. More sellers are selling this year.
As of today as I write this post, there are 866 condos listed in the NWMLS and 172 are non-traditional condo properties, or 19.8%, roughly 1 in 5.
One note about inventory. These figures only account for properties that have been actively listed for sale in the NWMLS system. There are many more properties available for sale in new condo buildings and townhome developments throughout the city that are not reflected in the NWMLS, thus the true inventory supply is a bit higher.
The Seattle condo inventory supply rate ticked up slightly to 3-months of supply, based on the rate of pending sales to available inventory. Overall, this keeps Seattle on the cusp between a seller’s market and a balanced market environment.
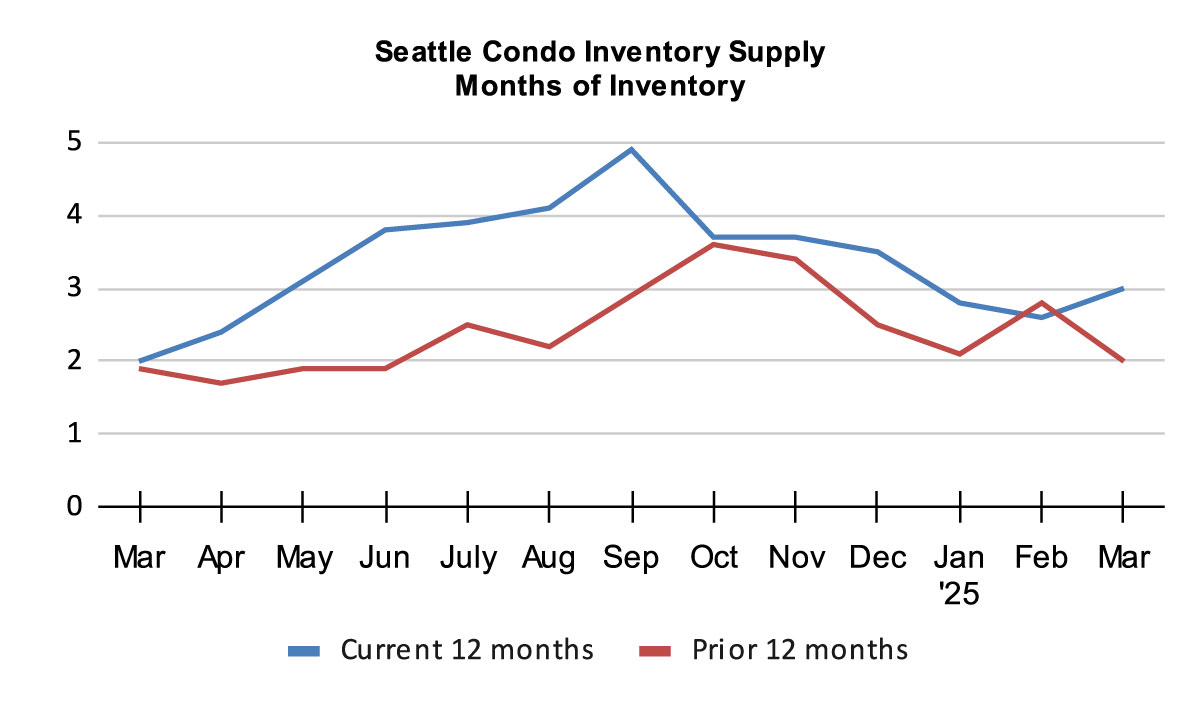
The inventory supply rate metric characterizes market conditions. A rate of less than 4-months of supply is considered a seller’s market. A rate from 4 to 7-months of supply is a balanced or normal real estate market environment. And, a rate greater than 7-months would be a buyer’s market.
Aside from a couple of anomalies, Seattle has been in a seller’s market (less than a 4-month supply rate) going back to the start of 2012. That said, Seattle’s real estate landscape is comprised of neighborhood and price point micro markets. As a result, depending on location and price range, buyers and sellers will encounter different experiences.
For example, areas like downtown, Belltown and Capitol Hill with a high density of condos and premium pricing levels will reflect softer market conditions compared to neighborhoods in North Seattle.
Market conditions can also be expressed by the absorption rate, which was 33.5% last month.
Seattle Condo Sales Remain Steady
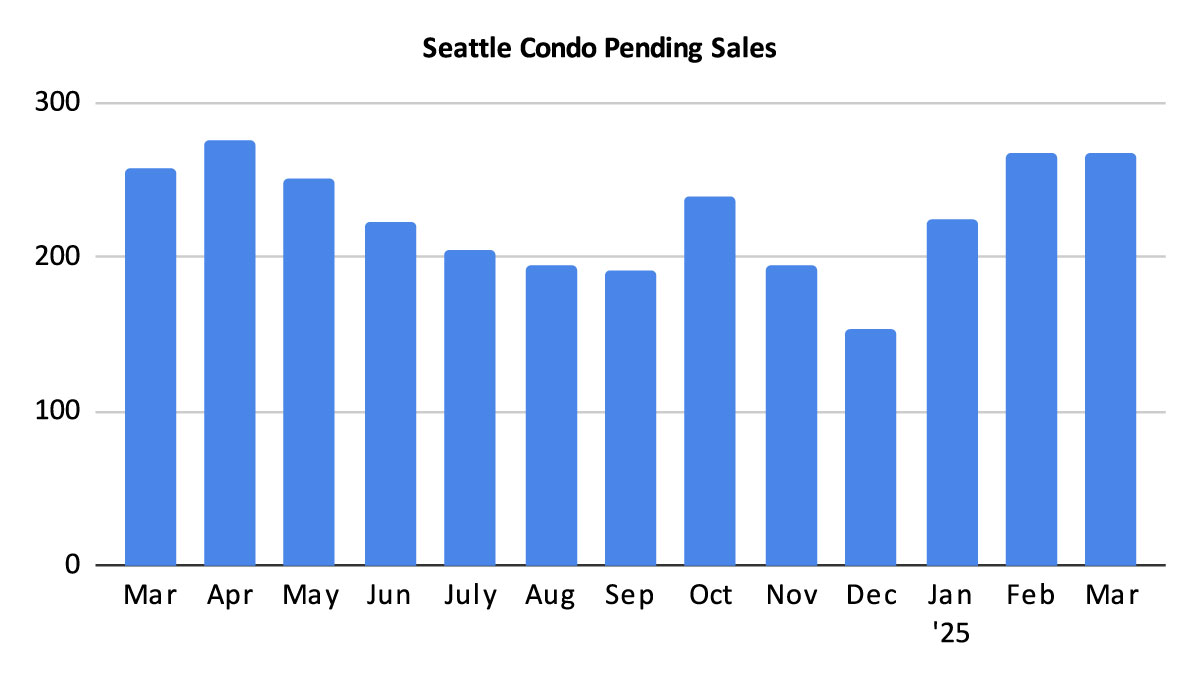
Pending condo sales activity improved slightly. These are properties with accepted offers in escrow. The number of pendings in March rose 4.3% over the same period last year, and 0.4% over the prior month, to 268 units.
The Pacific Northwest’s real estate market is seasonal and we are currently in the peak season. So far through the first half of April, we have about 140 units in pending status, so we’re on track to match last April’s pending sales number.
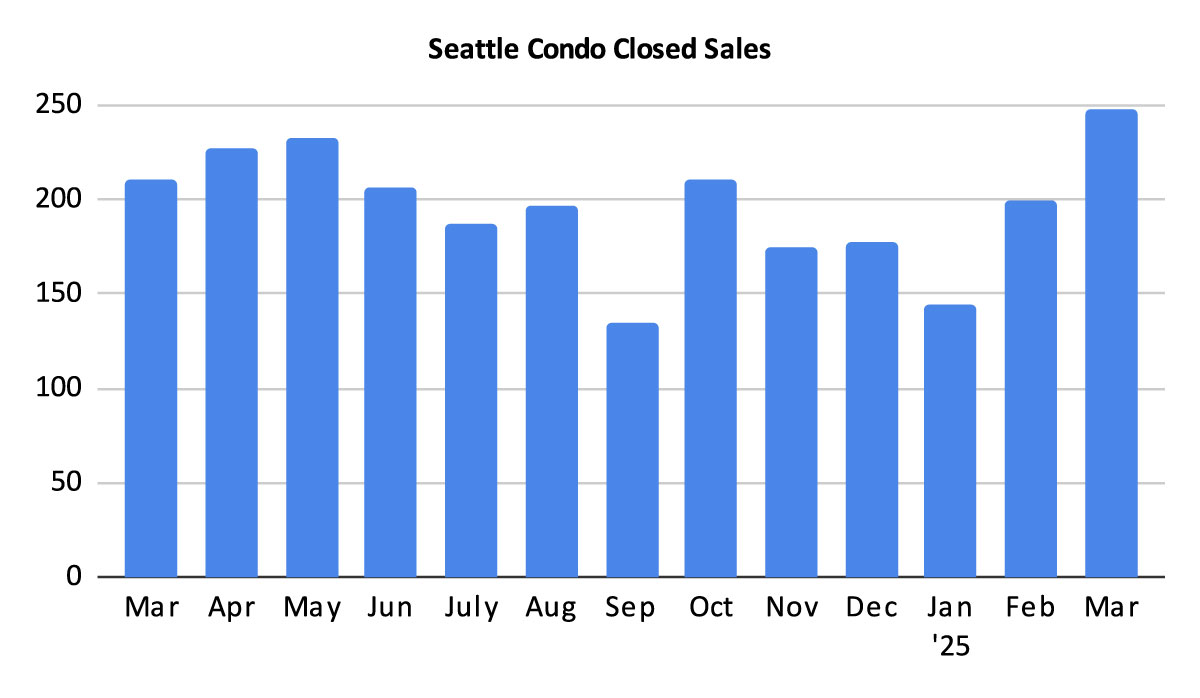
Seattle had 248 closed condo sales in March, an increase of 18.1% over last March and 24.6% more than the previous month. The increase resulted from the strong sales volume in February as closings lag pendings by a month. Presently, mid-way through April we’re at 112 closings, so we’ll be close to March’s closing number.
In Summary…
Depending on how you look at it, Seattle’s condo market was either solid or maybe it was a little underwhelming. As a whole, when including many non-traditional properties such as brand new townhomes, single family dwellings and detached accessory dwelling units (DADUs), the market was quite strong with rising values, inventory and sales.
However, when we exclude those and look at regular, traditional condo property units, the results are a bit different with a drop in their median sale prices and rising inventory.
For sellers looking to optimize their proceeds, they should take advantage of the spring market and sell before the cyclical Fall Season slowdown.
For buyers, the market will provide more options as listings increase, but there will also be greater competition from other buyers entering the market. It is the perfect time to start the process by contacting mortgage loan officers for a pre-approval. Drop us a note and we can help you get started.
Seattle Condo Market Statistics March 2025
Source: Northwest Multiple Listing Service. Some figures were independently compiled by Seattle Condos And Lofts and were not published by the NWMLS.
© SeattleCondosAndLofts.com