October 2024 Seattle Condo Recap

October turned out to be a solid month for Seattle’s condo market. Sales activity and median sales prices improved even though inventory remained high.
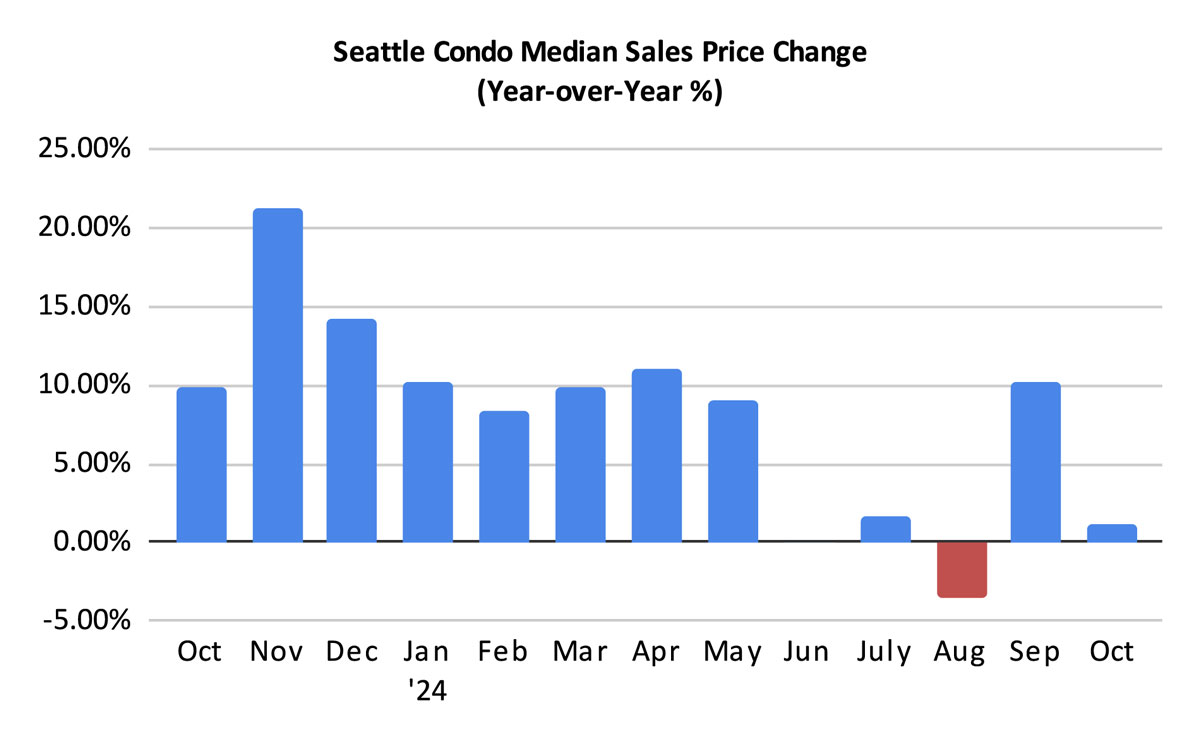
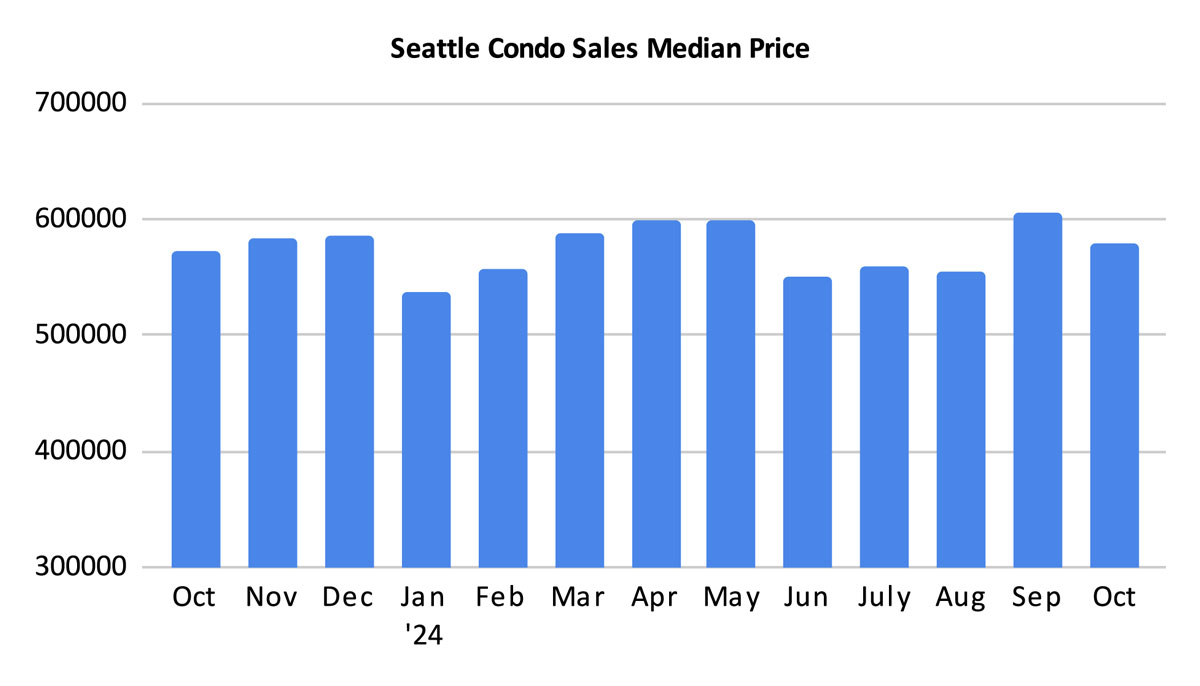
For the month, the Seattle citywide condominium median sales price increased 1.1% year-over-year to $580,000. But, that also reflected a 4.3% dip from the prior month, which was the all-time record high. The month-to-month decline is typical as we round out the second half of the year as prices trend downward during the fall months.
By NWMLS neighborhood areas, Northeast Seattle (+44.3%), Queen Anne / Magnolia (+20.3%), Northwest Seattle (+15.4%) and West Seattle (+2.5%) experienced increased median sales prices in October. On the other hand, Downtown / Belltown (-20.6%), Capitol Hill / Central (-15.8%), Southeast Seattle (-37%) and South Seattle (-25.6%) exhibited decreases to their median sales prices. View complete October stats here.
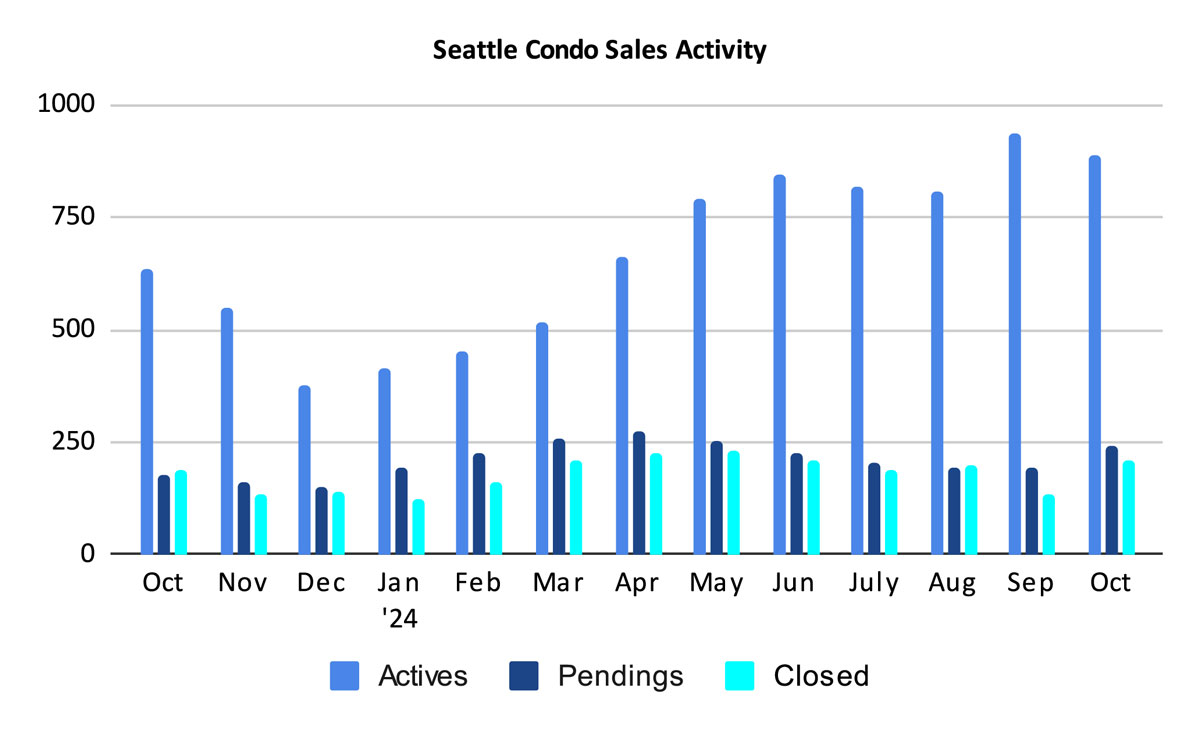
Seattle’s inventory of active condo listings continued to rise, although at a slower pace. We ended October with 887 condo listings for sale, an increase of 40.4% year-over-year, but 5.4% fewer than we had in the prior month.
We started the month with 938 listings and sellers added 365 new listings for a total of 1,303 listings in October. In the prior month, sellers added 449 new listings, so the rate of new listings slowed by 18.7%. Again, not unexpected given the Fall seasonal slowdown.
Of the 1,303 total listings in October, 416 came off the market due to sales (pendings/closings) or because the listings were cancelled, had expired, rented out or were temporarily removed from sale, leaving 887 units at month end.
The overall number of listings will reduce as we close out the year with November and December being the slowest months for real estate.
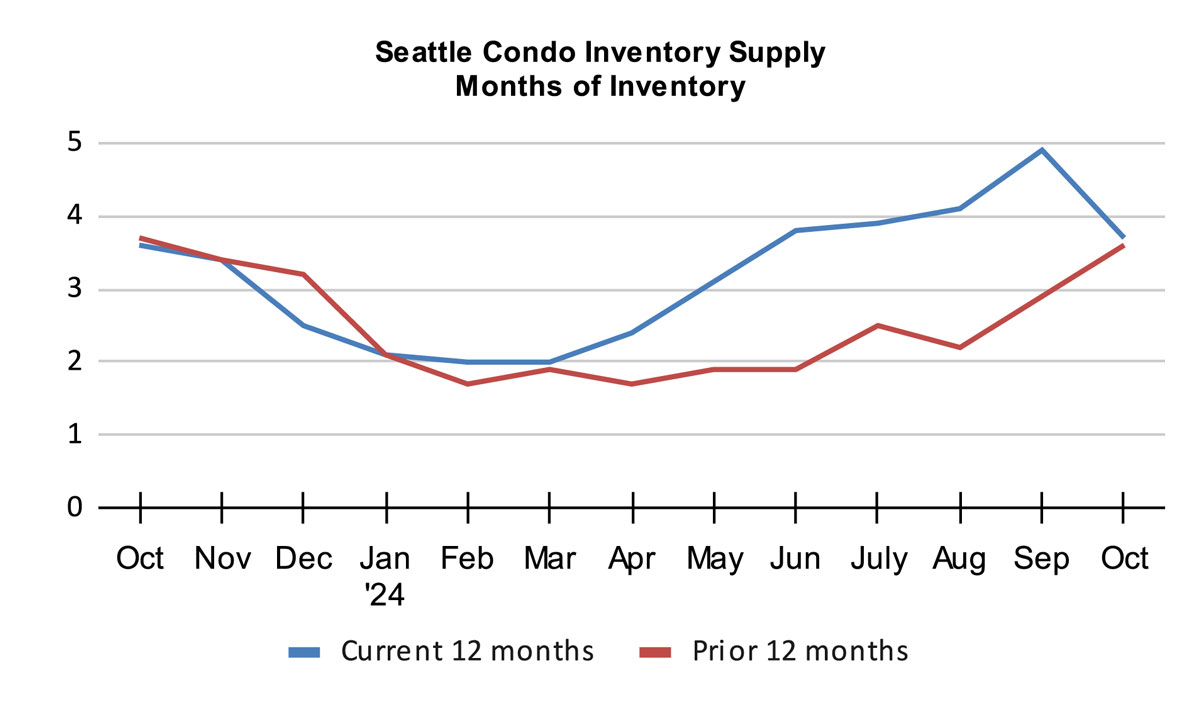
Even with a ample number of listings in October, the Seattle condo inventory supply rate dropped to 3.7-months of supply based on the strength of condo sales. This is on par with where we were a year ago and moved Seattle back towards the cusp between a balance market and a seller’s market.
The inventory supply rate characterizes market conditions / environment. A rate of less than 4-months of supply is considered a seller’s market. A rate from 4 to 7-months of supply is a balanced or normal real estate market. And, a rate greater than 7-months would be a buyer’s market.
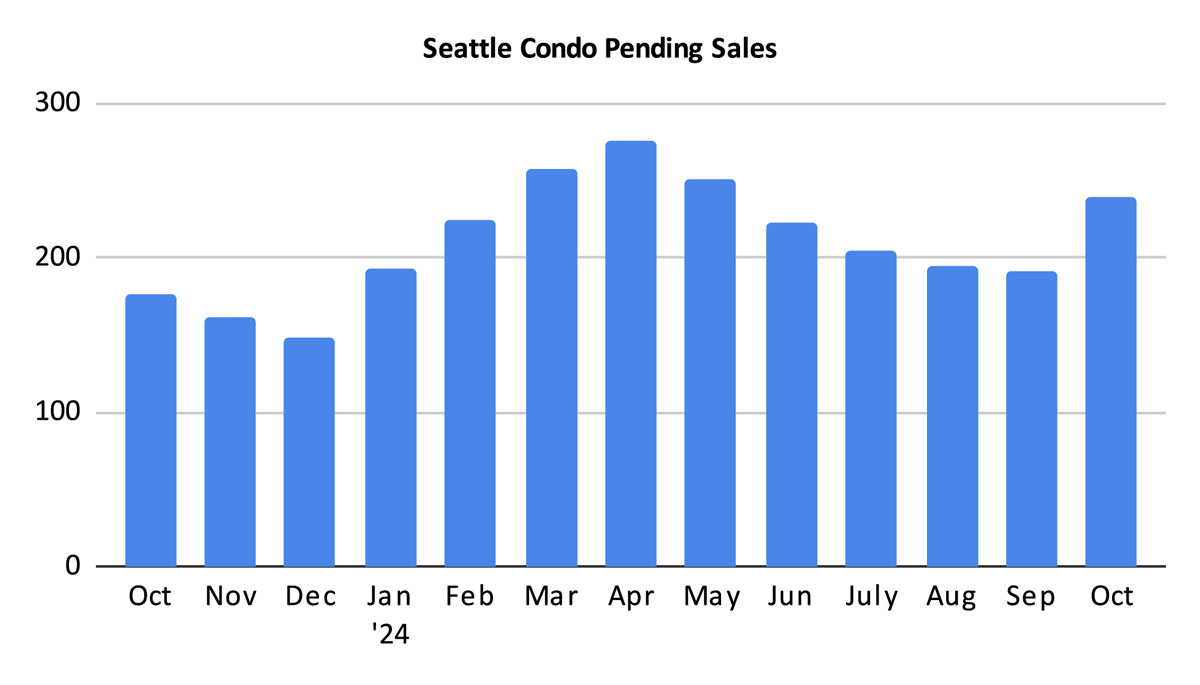
What is most notable about October’s condo market results was the number of pending condo sales transactions. There were 240 units that went under contract reflecting a one-year and a one-month increase of 35.6% and 25%, respectively.
For all the recent talk of the market slowing due to rising interest rates, buyers waiting out the election, or employment concerns, buyers did not hold back from purchasing condos in October. Though, we do anticipate sales velocity to reduce as we close out the year, so it is foreseeable the supply rate will increase.
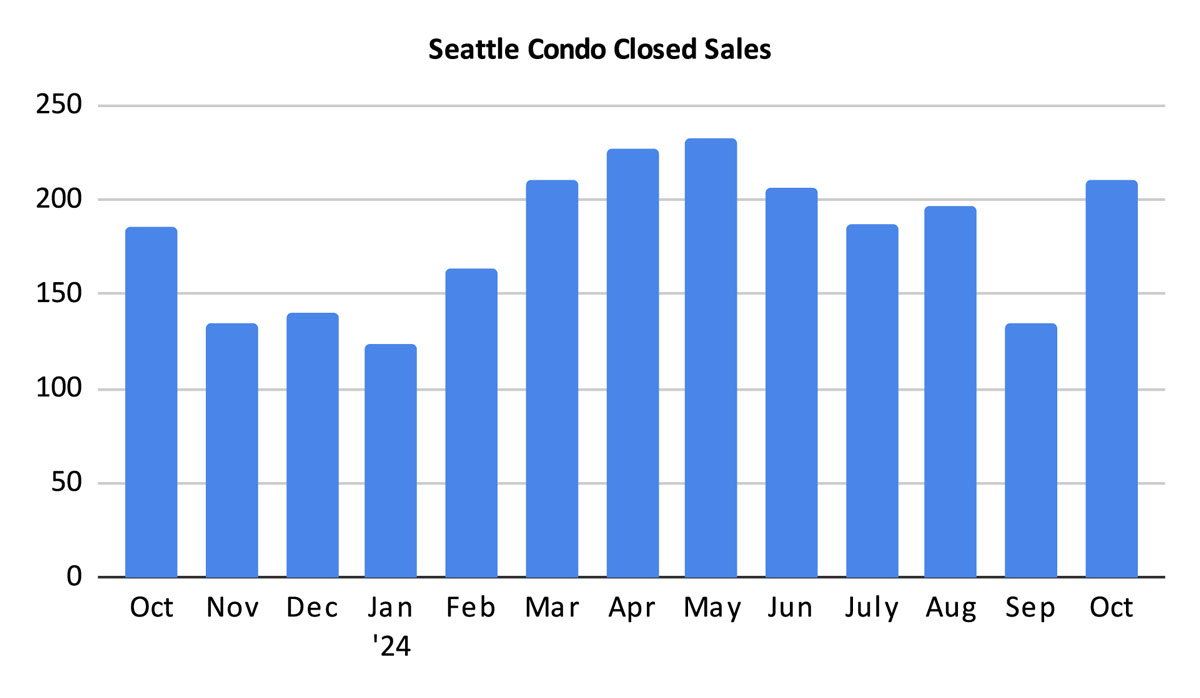
Condo closings also improved in October with 210 closed units. That reflected a year-over-year increase of 12.9% and a one-month spike of 55.6%. Closings lag behind pendings by a month or two, so October closings reflected pendings from August and September.
October turned out to be a solid month for Seattle’s condo market. Even though the number of listings remained high, condo sales and prices improved for the month. That may be short-lived, however.
Given our cyclical, seasonal real estate market, the market will slow considerably during November and December. The change in weather, limited daylight and the busy holiday season tend to draw buyers away from house hunting.
Seattle Condo Market Statistics October 2024
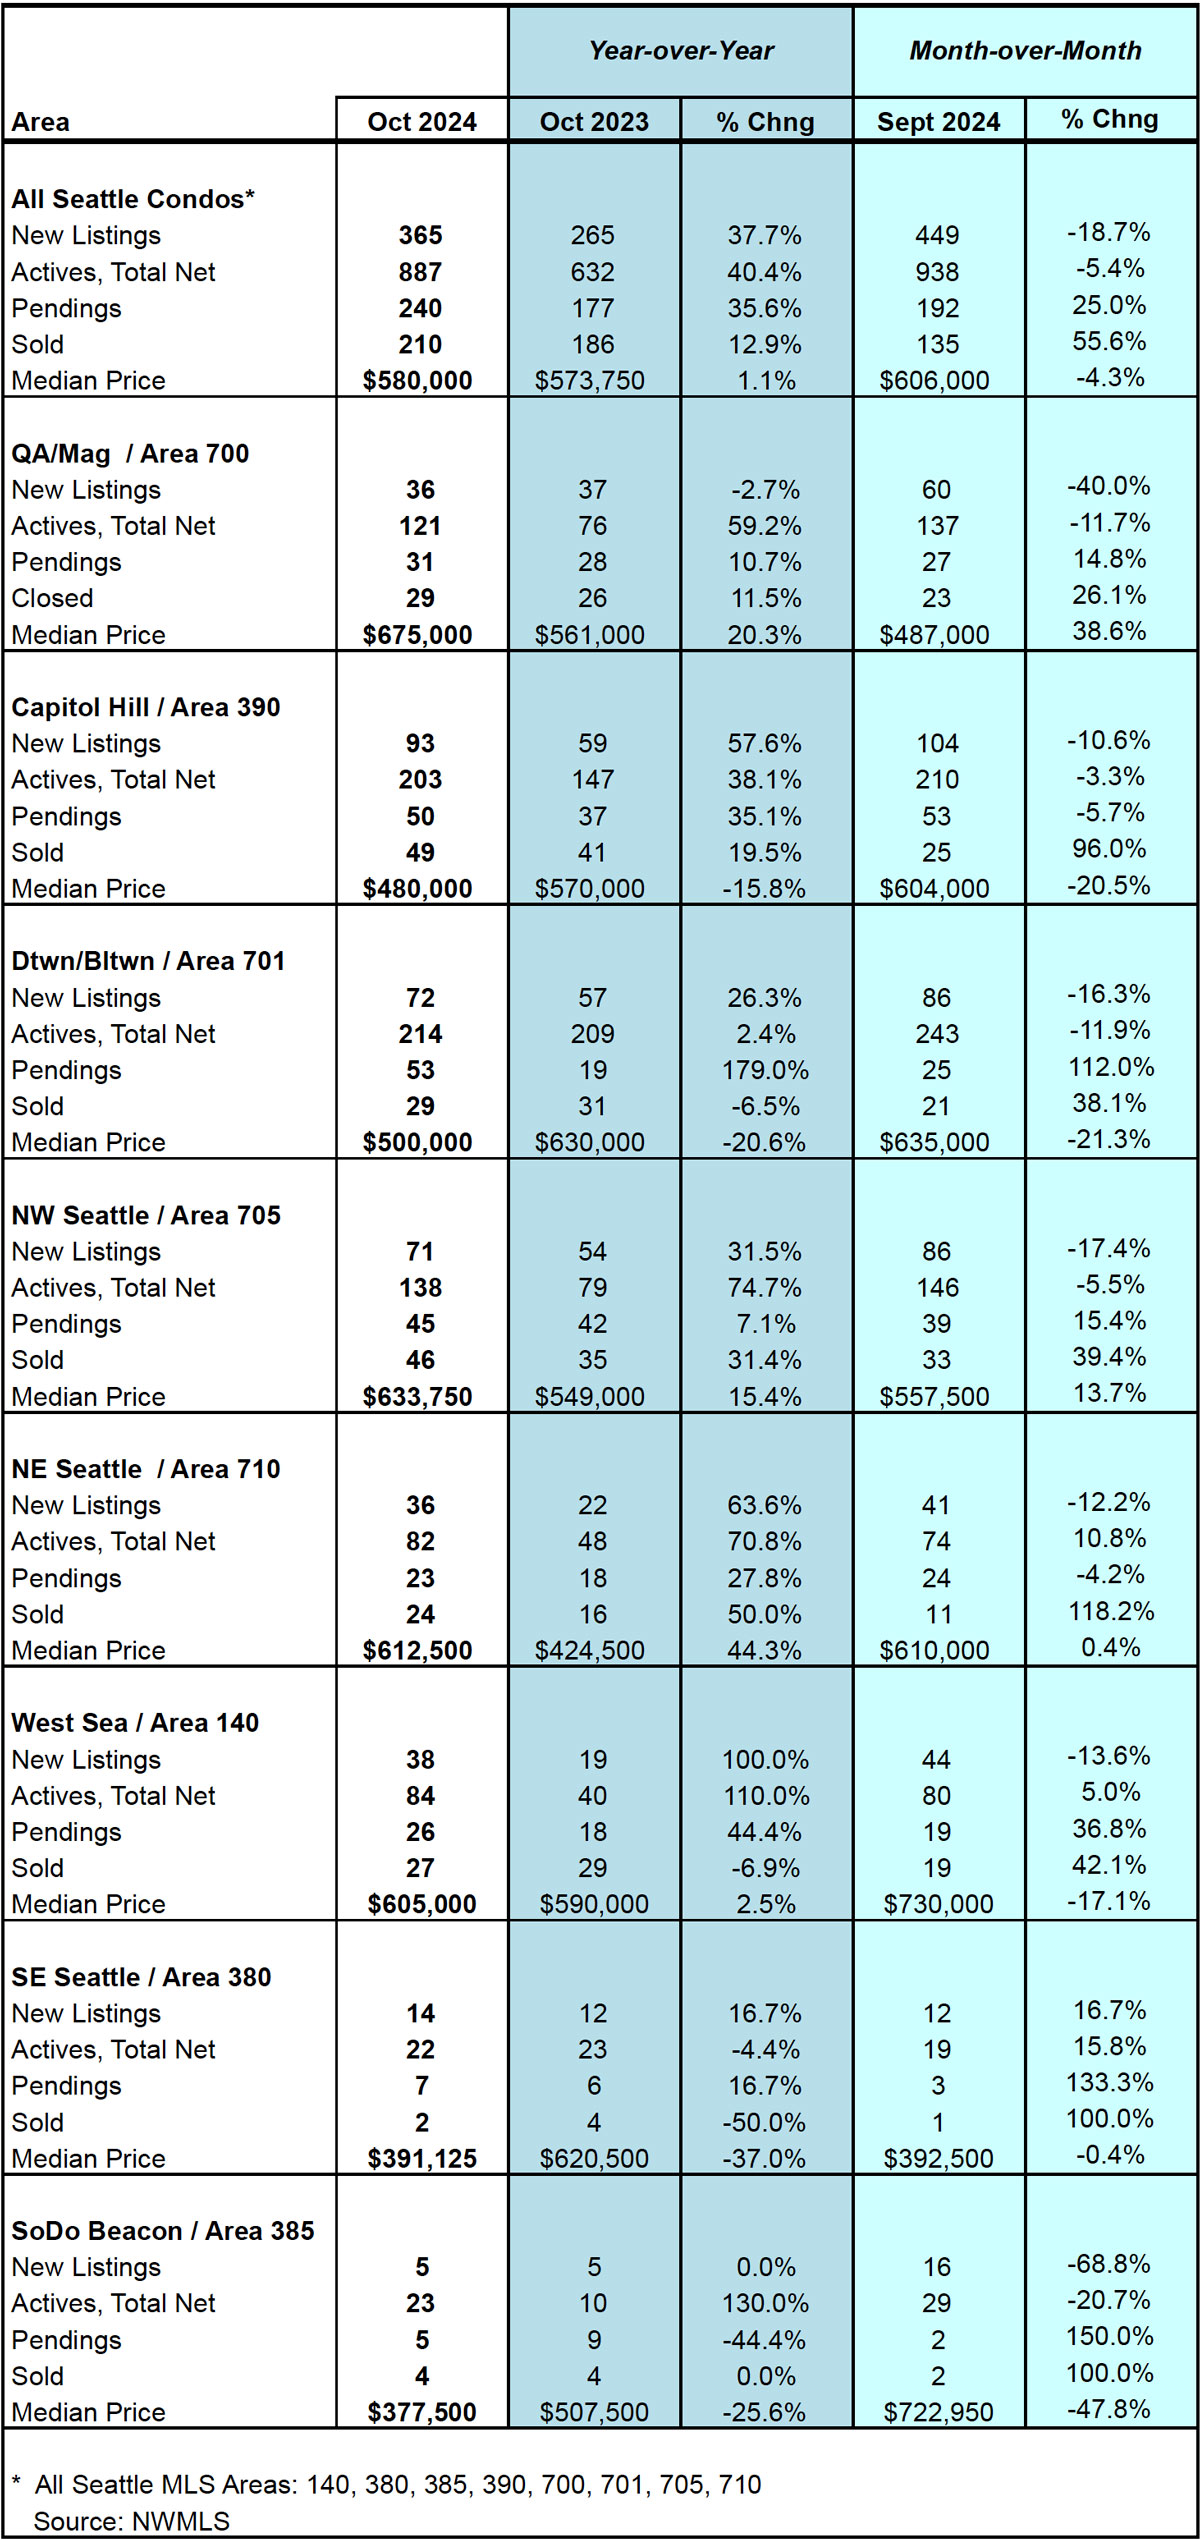
Source: Northwest Multiple Listing Service. Some figures were independently compiled by Seattle Condos And Lofts and were not published by the NWMLS.
© SeattleCondosAndLofts.com

