Seattle Condo Q1 2017 Market Update
It should come as no surprise Seattle condo buyers and sellers experienced a robust first quarter 2017 housing market with historic low inventory levels, fervent demand, and rising condo values.
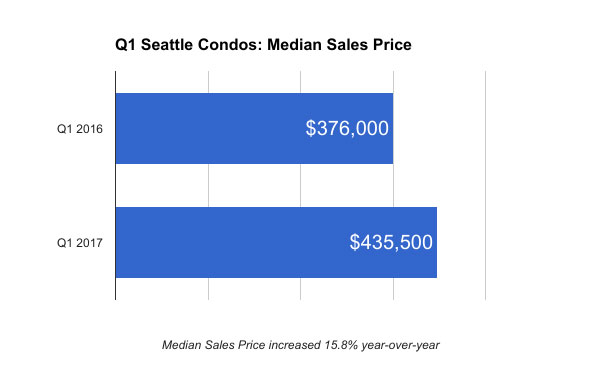
Seattle condo prices continued to climb with the citywide condo median sales price outpacing Q1 2016 by 15.8%, rising to $435,500 for the quarter.
The composition of the units sold may have contributed to the rise in median sales price as well. For instance, 22.6% of units sold in 2016 were priced above $500,000 compared to more than 39% in 2017. With a greater number of higher valued units selling in 2017, relative to total sales, the midpoint (median) shifted upwards.
Conversely, the number of affordable condo sales (less than $350,000) reduced 35% between Q1 2016 and 2017 from 270 to 176 units, resulting in a tighter squeeze for many first time homebuyers.
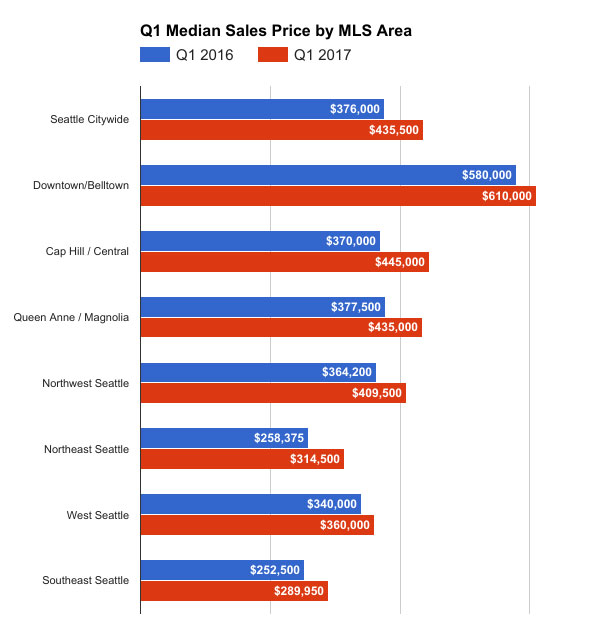
Median sale prices rose and exceeded 2016 values throughout the city by NWMLS Areas, which are geographically large and diverse (click to view NWMLS Area map). Thus, when looking at Capitol Hill / Central figures, which is NWMLS Area 390, it includes Capitol Hill, Eastlake, First Hill, Madison Park and the Central District. I’ll break out the Q1 results by actual neighborhoods in a subsequent post.
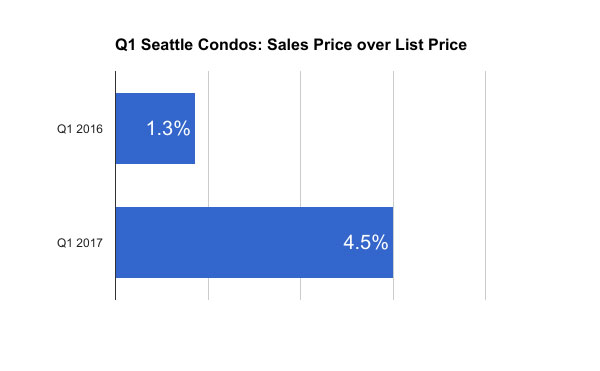
As you’d expect Seattle condo sales are generating a premium value for sellers due to low inventory and fierce competition and bidding wars from determined buyers. On average, condos in Seattle sold for 4.5% over the list price in Q1 2017 compared to 1.3% in Q1 2016.
Though, the sales price to list price percentage varies widely depending on neighborhood, type of unit (# of bedrooms) and price points, which I’ll highlight further in another post. For example, while the city average is 4.5% it’s not uncommon to see studios and one-bedrooms sell for more than 15% over the list price in the downtown area.
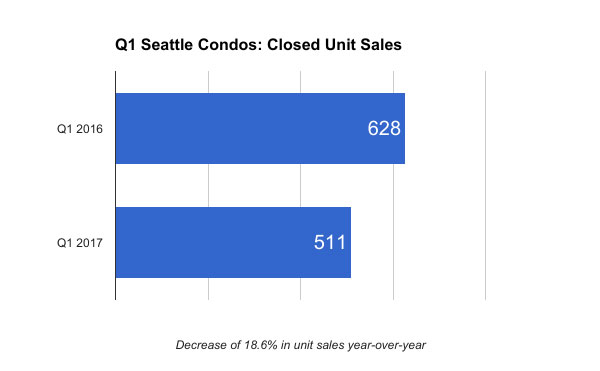
The number of closed condo sales in Seattle reduced by 18.6% to 511 units. New construction closings played a big part of that with 1st quarter 2016 sales boosted by new construction closings at the VIK Condominium, which completed in January 2016, and Insignia (125 new construction closings in Q1 2016 vs just 31 in Q1 2017).
Additionally, the reduced closings can be attributed to sellers having limited options themselves in respects to finding and buying another home thus many are staying put rather than selling, as well as owners taking advantage of the strong rental market and leasing their units instead.
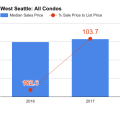
See Q1 2017 median sale prices and percent of sales price to list price by neighborhoods:
Seattle city core neighborhoods
North end neighborhoods
South/West Seattle neighborhoods.
Heading into the second quarter, the cyclical peak of the local housing market, we’ll see even stronger results.
Note: The figures used are based only on unit sales at traditional condominium buildings and excludes townhome developments set up as condominiums.
Source: NWMLS. All figures were independently compiled by SeattleCondosAndLofts.com and were not published by the Northwest Multiple Listing Service.


