August 2023 Seattle Condo Market Update
The Seattle condo market reached new heights in August breaking the sales price record even as sales activity softened.
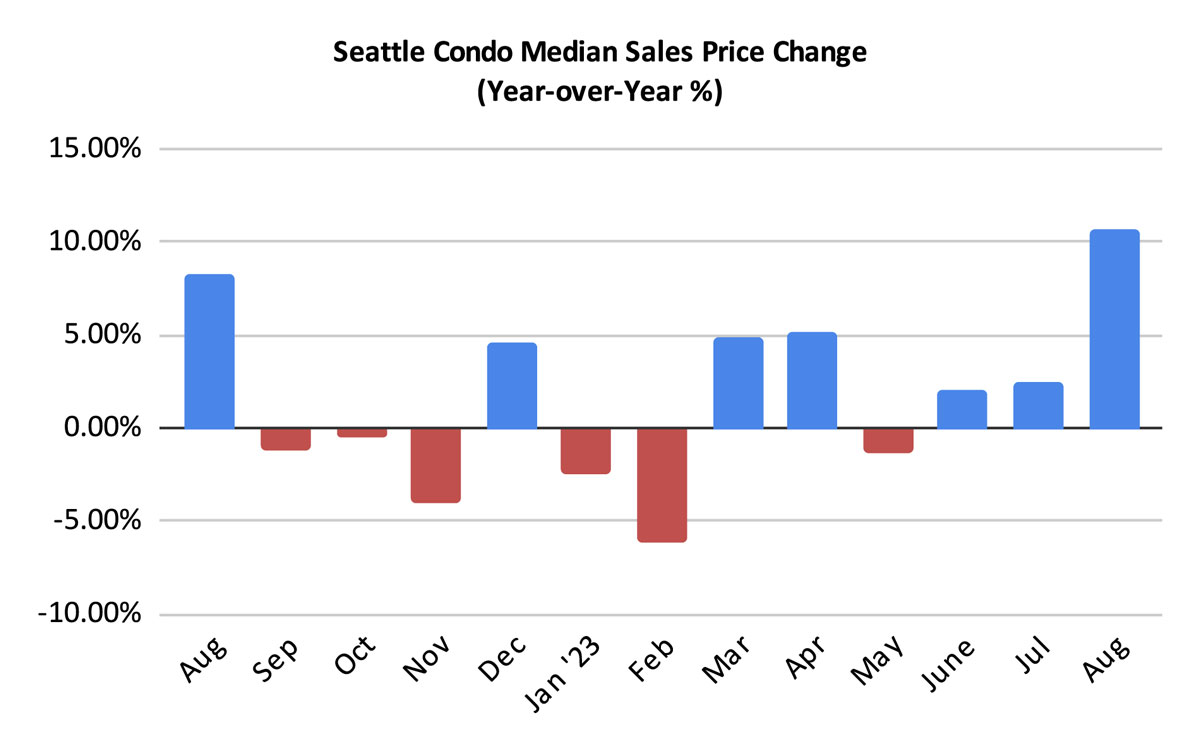
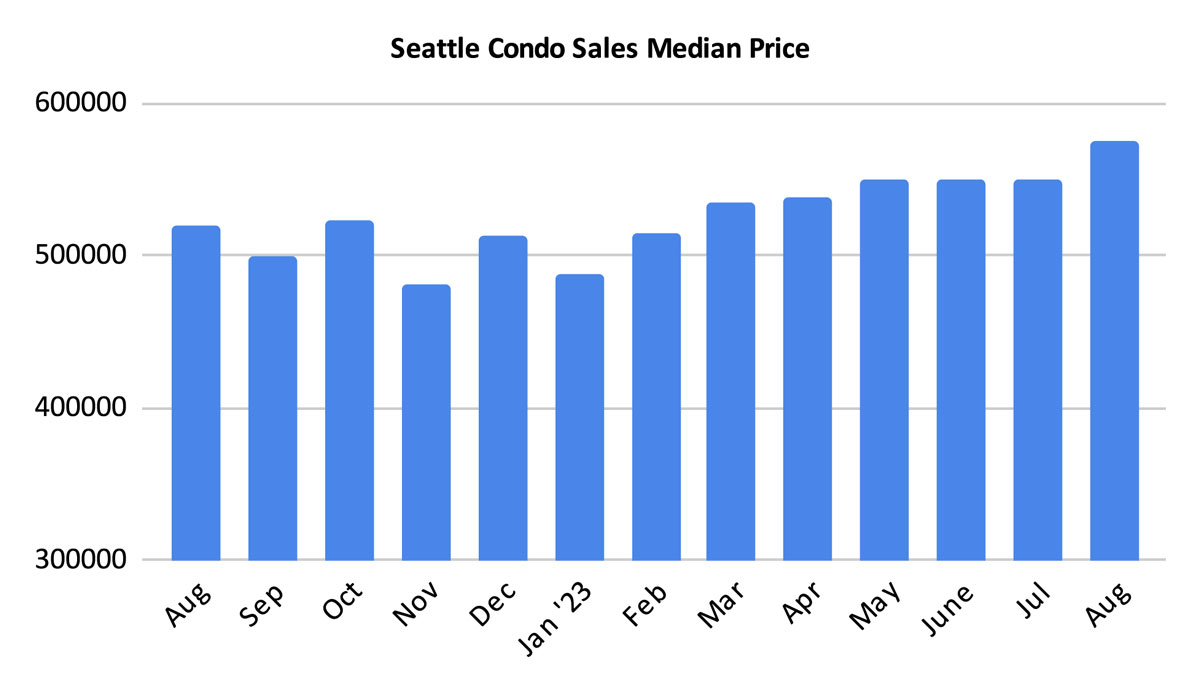
The Seattle citywide median sales price for condos rose to $575,000, a new all-time high. That reflected a year-over-year and a one-month increase of 10.6% and 4.5%, respectively.
But, there is a caveat to that, which I’ll get to later.
Every NWMLS neighborhood area reflected a year-over-year (YOY) improvement. Northwest Seattle (+26.3%), Queen Anne / Magnolia (+13.4%), Northeast Seattle (+12.7%) and Capitol Hill / Central (+10.6%) lead the way with double-digit increases. View all neighborhood results in this table here.
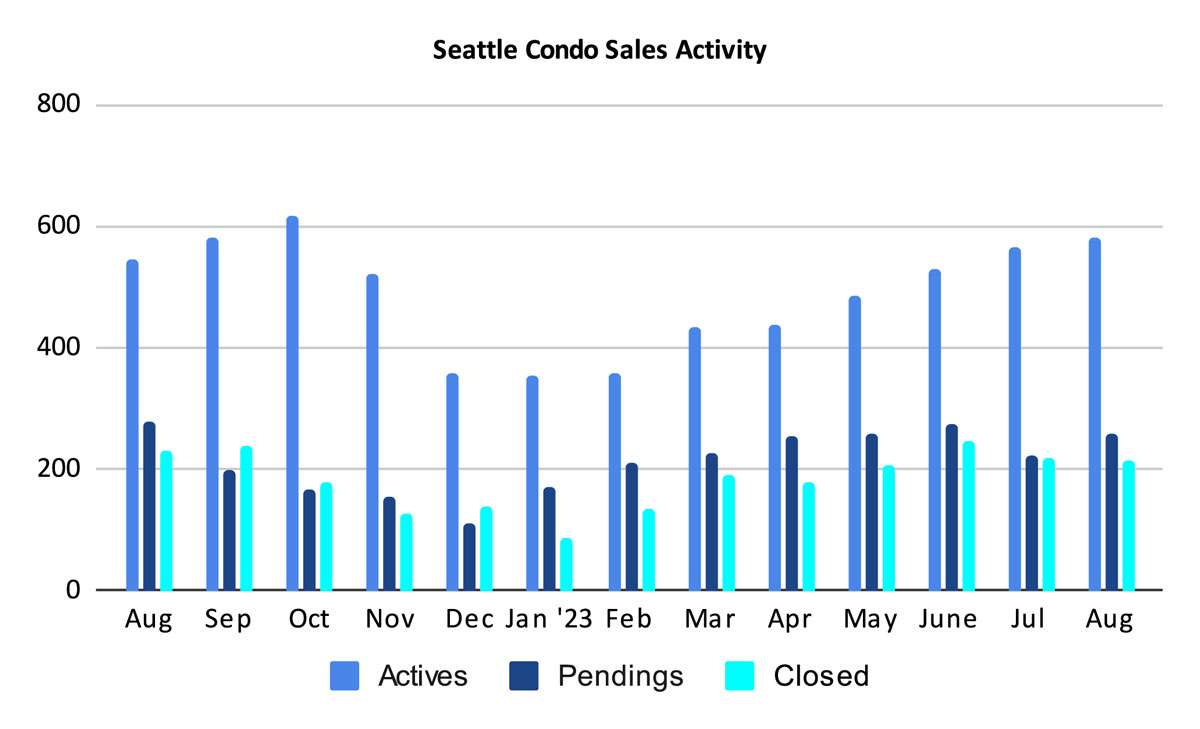
The number of Seattle condos listed for sale also increased in August. In terms of new listings coming to market there was a 5.7% increase compared to last August and 4% more than the prior month. For the first time in several months the number of new listings this year has outpaced last year’s level, that is, more sellers listed units for sale relative to the same period last year.
Seattle ended the month with 580 condos for sale, which represented a YOY increase of 6.4% and a one-month improvement of 2.5%.
A recent trend of new townhome developments and in-fill detached accessory dwelling units (DADU) and accessory dwelling units (ADU) has been to organize the properties as condominiums. This occurs regardless if the development consists of 10 townhomes or 2 units. For instance, a developer or a homeowner might add a DADU to an existing single family home but rather than subdividing the property into two individual fee simple lots, it’s set up as a 2-unit condominium.
This leads me back to my caveat about the jump in median sales price. Townhome and DADU/ADU units are usually far more expensive than the typical condo unit (e.g. a flat in a multi-unit building). And, they accounted for approximately 17% of the condo sales in August. That might not sound like a lot, but it was enough to shift the median, or mid-point, upwards. If we exclude these properties and base sales just on traditional condominium units, then the citywide median would have been $500,000 last month.
This has had a considerable impact in areas like the northend where new townhomes are plentiful. In Northwest Seattle, for example, 36% of condo sales in August were townhomes and DADU/ADU units. If we exclude these, the median sales price for Northwest Seattle would have been $515,000 instead of $612,475.
On the other hand, it had minimal impact in areas such as downtown and Capitol Hill, where the increase were attributable to appreciation and higher-end units sales. See this table for more neighborhood results.
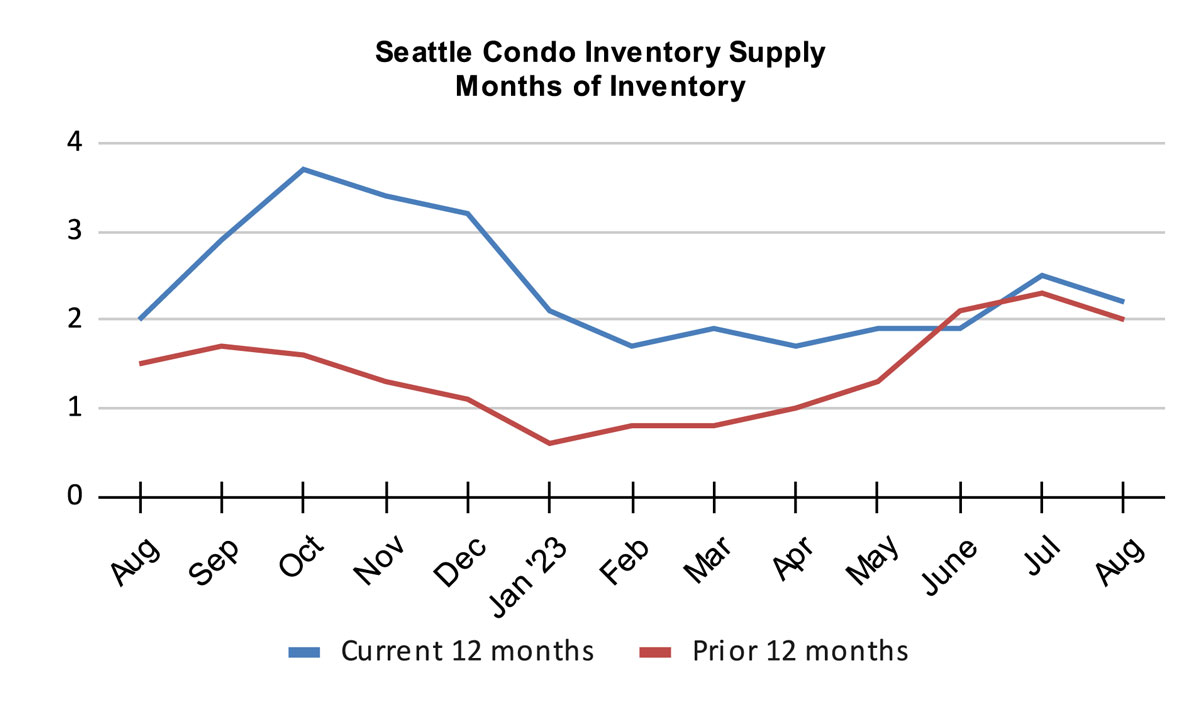
Interestingly, the Seattle condo inventory supply rate decreased eventhough the number of listings increased thanks to the bump in sales for the month.
The citywide inventory supply rate dipped to 2.2-months of supply based on pending sales activity. It should come as no surprise now that Seattle, overall, remains in a seller’s market..
But, Seattle is comprised micro real estate markets, mostly defined by location and price points. For instance, the condo dense and higher-priced downtown area has more than 4-months of supply, which is indicative of a normal or balance market environment. And, at 3.5-month of supply, Capitol Hill was on the cusp of a normal market in August.
Generally, a rate under 4-months of supply is considered a seller’s market, between 4 to 7-months of supply is a balanced market, and more than 7-months would be a buyer’s market.
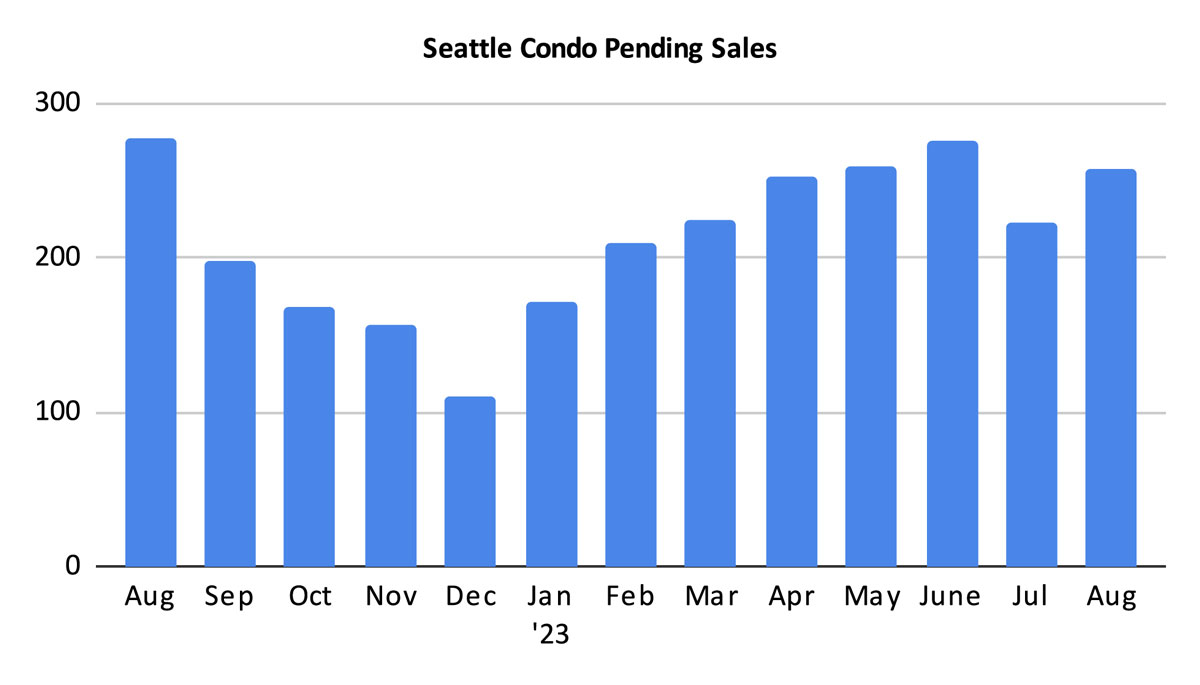
There was a decent bounce in the number pending sales transaction of 16.2% over July to 258 units that were under contract. However, that also reflected a YOY drop of 6.9%.
After August of last year condo sales plummeted, see graph below. Presently, however, activity remains stable though higher interest rates have dampened buyers enthusiasm a bit. While we will see the market seasonally slow down during the second half of the year, I anticipate it will fare better than 2022.
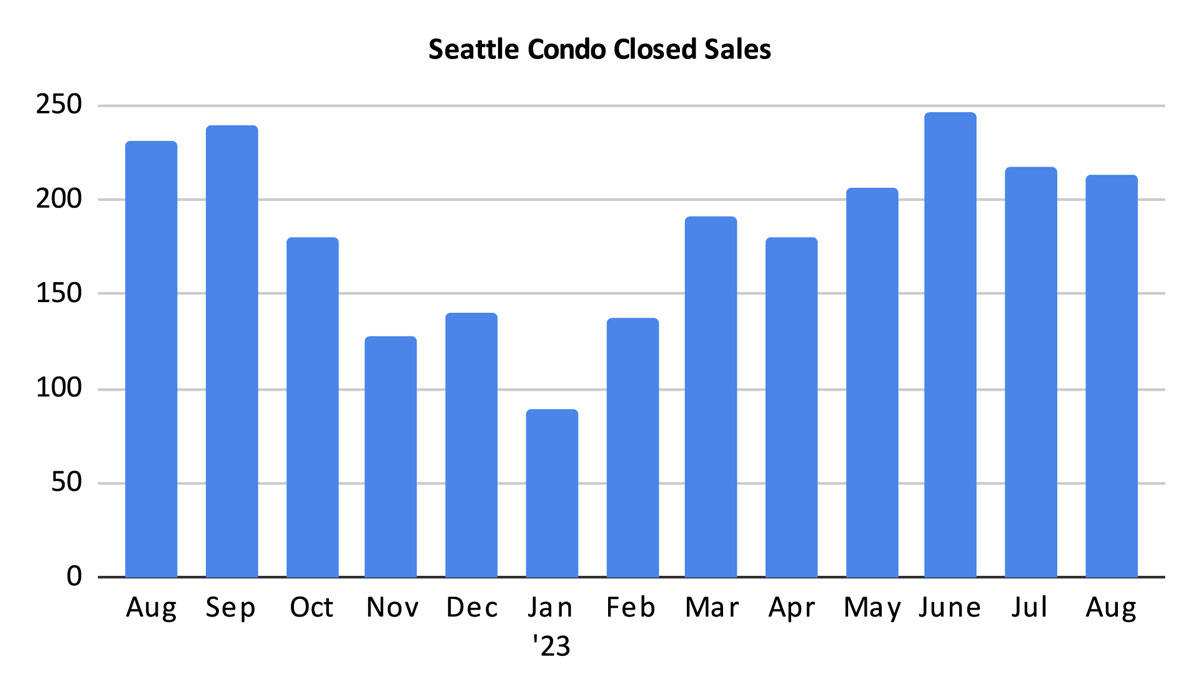
The number of closed condo sales dipped in August to 213 units. That was 7.8% fewer compared to last August and 1.8% fewer than the prior month. Fortunately, that should tick back up in September since closings typically lag behind pendings by a month.
August was a banner month for Seattle’s condominium market with a new record high citywide median sales price. However, that $575,000 figure was highly influenced by the recent trend of setting up townhomes and in-fill developments (DADU/ADU) as condominiums.
For now, this skews the statistics when looking at year-over-year numbers (listings, selling prices, etc) since 2022 condo sales were predominately traditional condo units. Though, this resets the definition and statistics of condominiums going forward to be a mix of flats in multi-unit buildings, townhomes/rowhouses, stand alone townhomes, DADUs, ADUs and single family houses with DADU/ADUs that have been reclassified as a condo.
A DADU was built behind this 1950’s single family house, pictured below. As a result, the property was reclassified as a condominium. This house is now a condo.

Seattle’s real estate market is highly seasonal and we usually follow the same cycle every year. Thus as we enter the second half of the year we will start to see softening in the market place with fewer sales and lower selling prices.
Seattle Condo Market Statistics August 2023
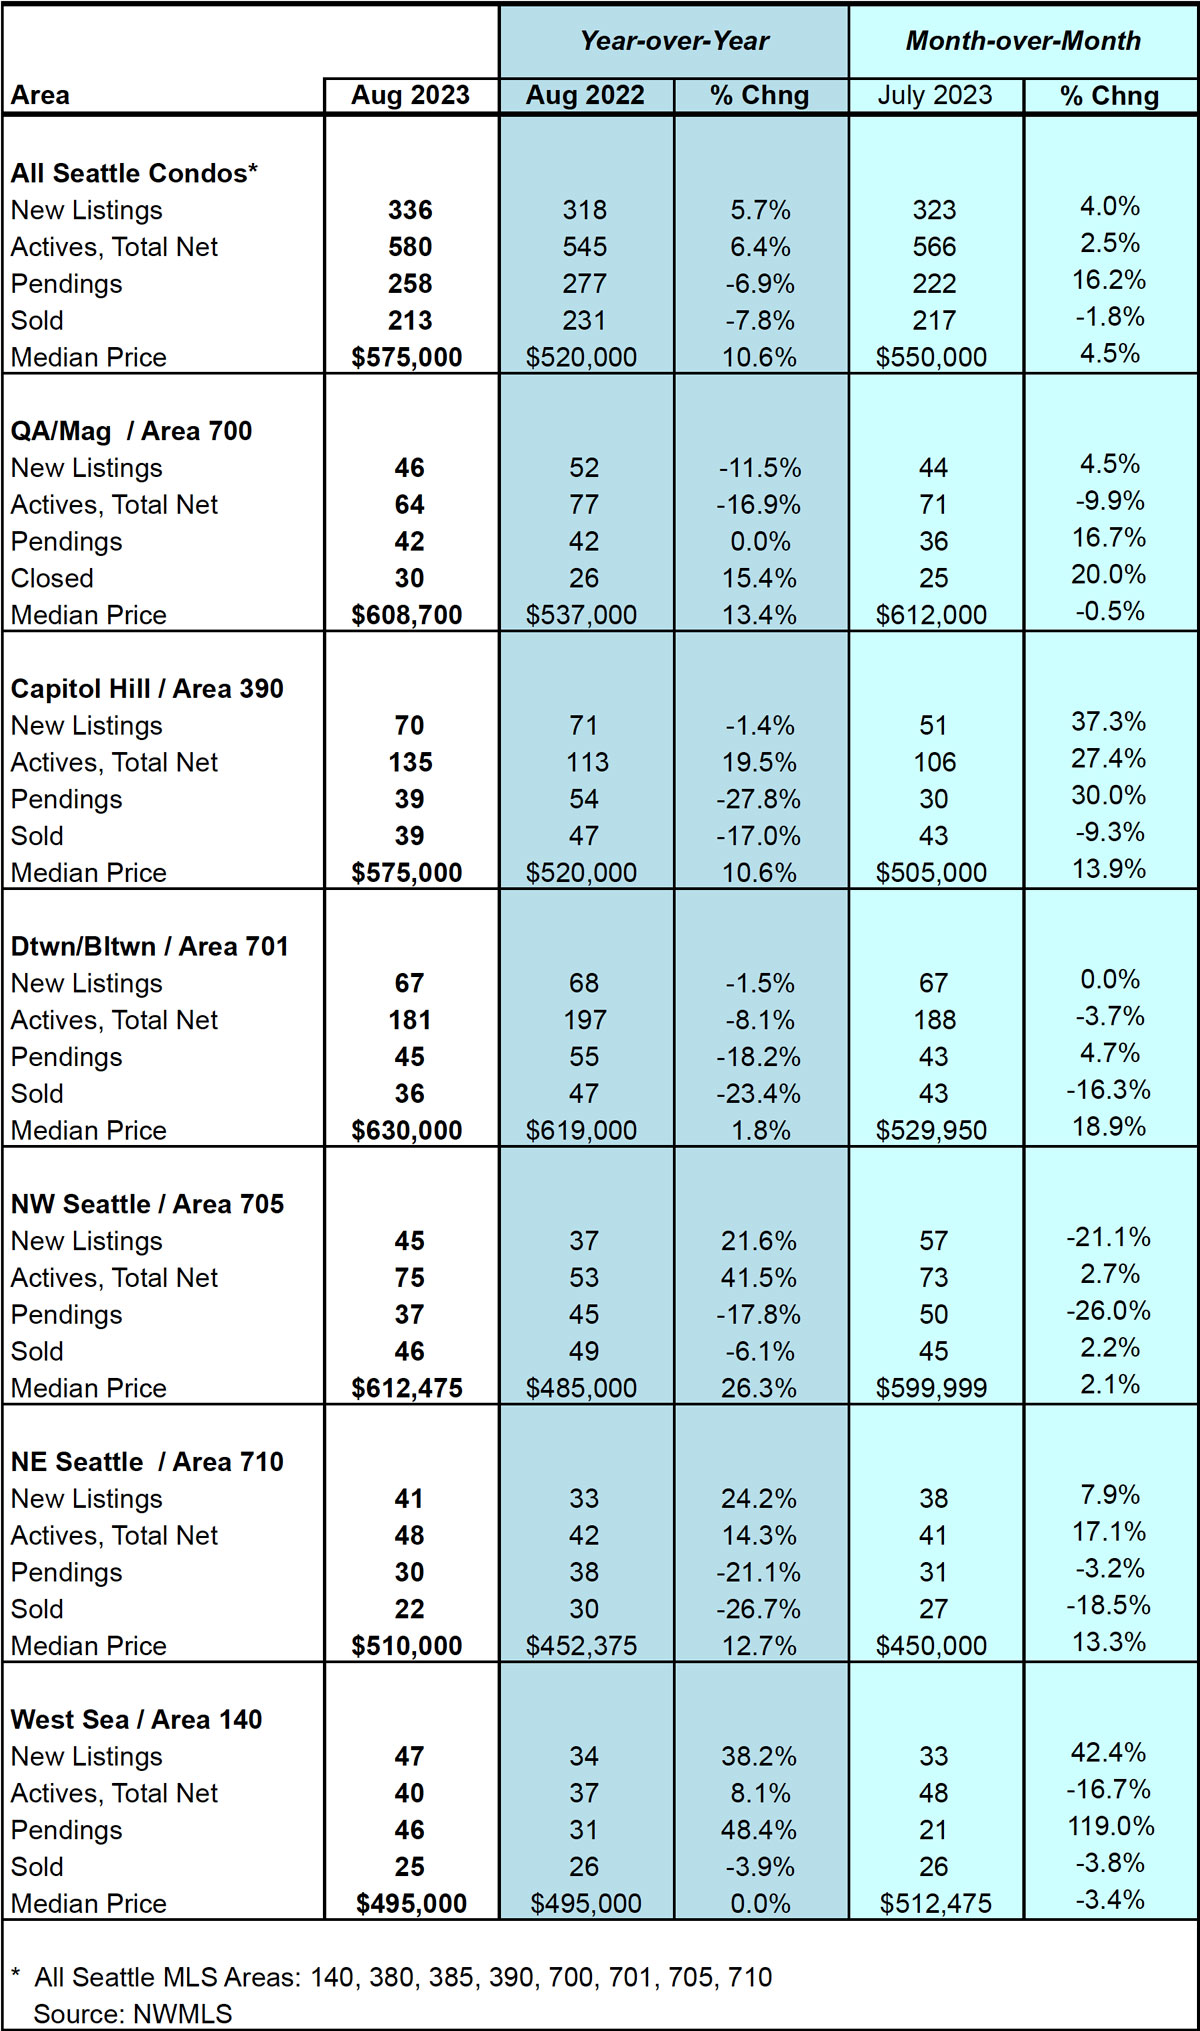
Source: Northwest Multiple Listing Service. Some figures were independently compiled by Seattle Condos And Lofts and were not published by the NWMLS.
© SeattleCondosAndLofts.com

