Seattle Market Update August 2018
It’s a buyer’s bonanza! Well, not quite yet but it we’re rolling briskly in that direction. For now, Seattle’s condo market is a bit of a contradiction, at least in August with skyrocketing inventory along with rising values.
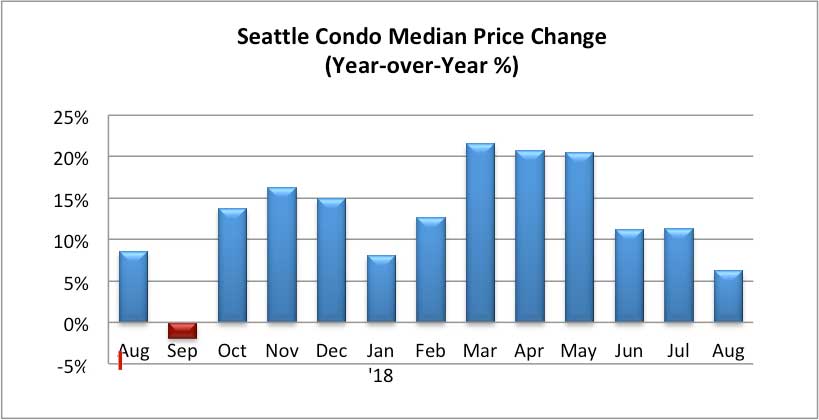
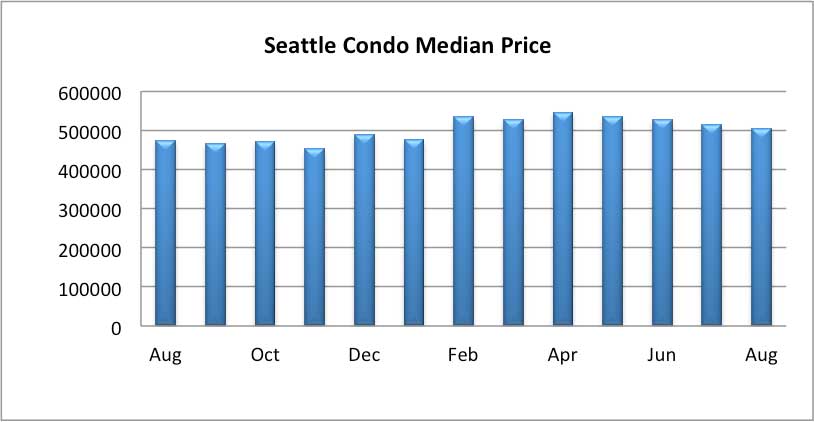
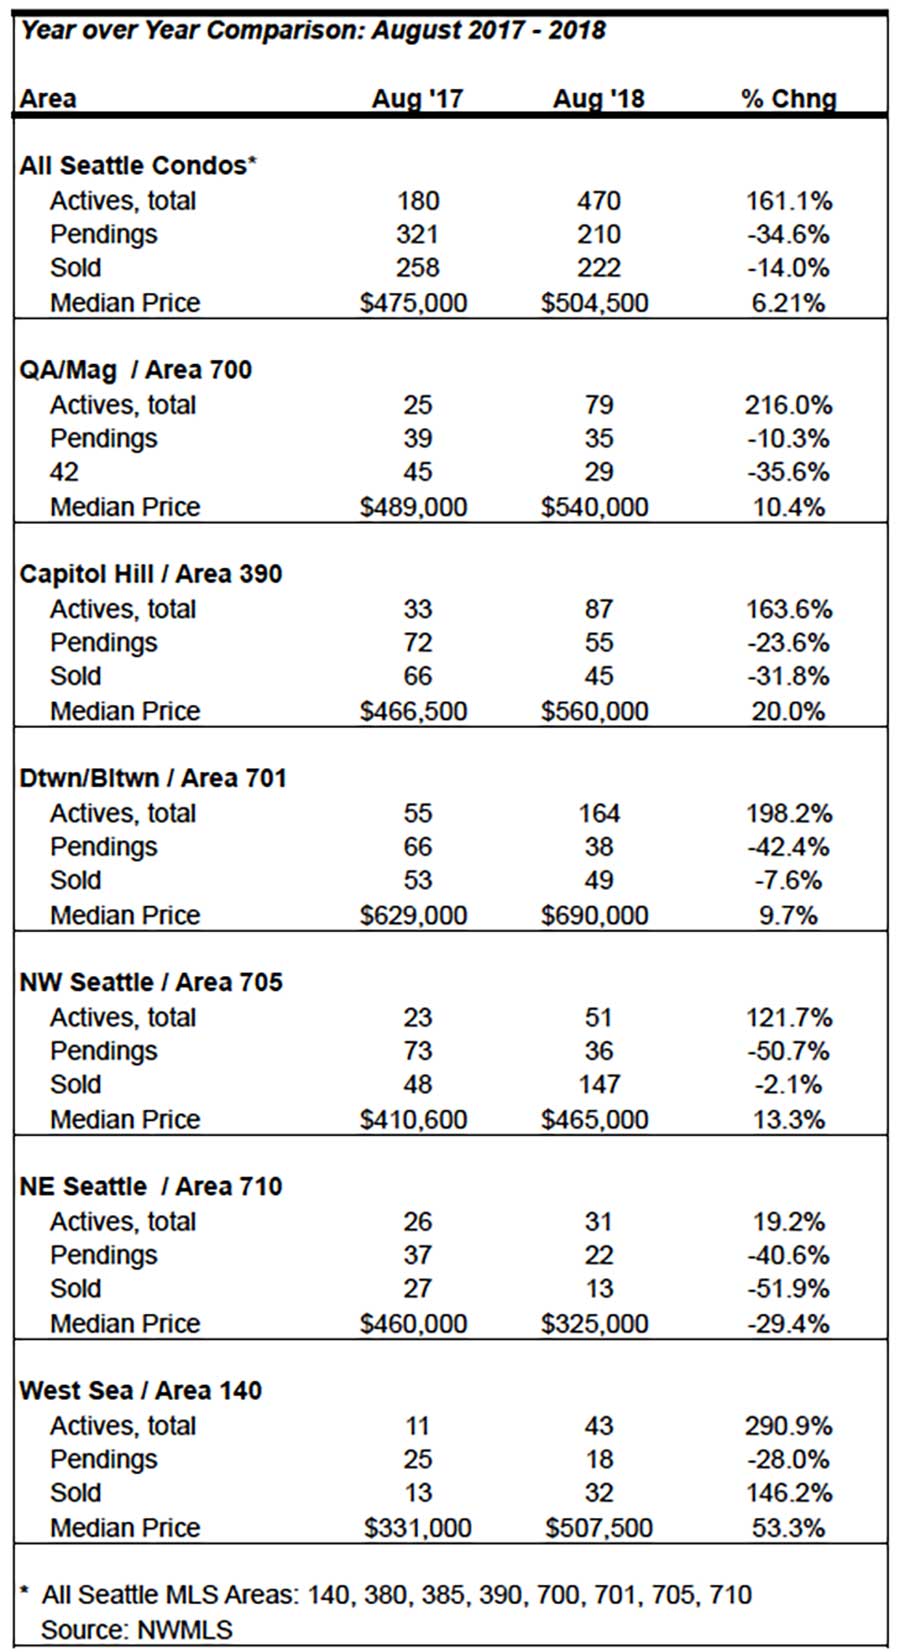
The median Seattle condo sales price rose 6.21% year-over-year to $504,500. Though, compared to the prior month, it dipped 1.8%. With the exception of Northeast Seattle, all areas realized year-over-year increases in the median sales price, mostly by double-digits (see table at bottom of post).
That will start to reverse, however, given the rise in inventory and market seasonality as we progress through the second half of the year.
Inventory rose an incredible 161% over the same period last year, reflecting 470 Seattle condo listings for sale last month. That was also 16.6% more than in July. Historically, we’d normally see inventory taper off by now.
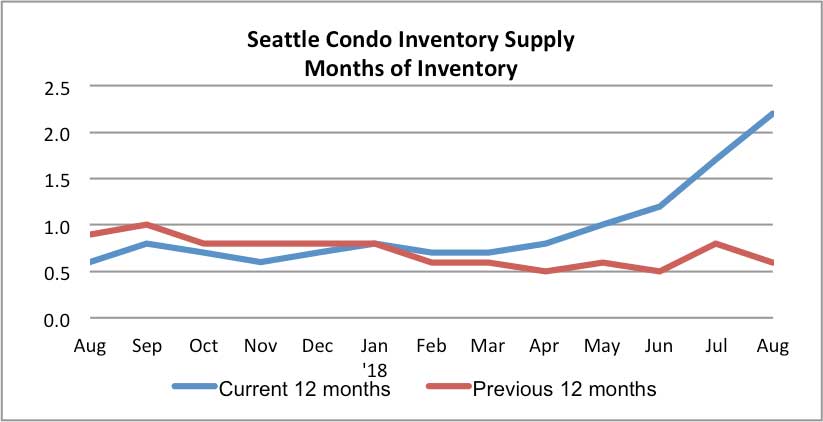
With the spike in listings and tempered sales, the inventory supply rate increased to 2.2-months of supply. That’s significant for two reasons.
First, it is the first time in five years that the supply rate surpassed 2 months of supply.
Second, the supply rate is an indicator of market condition with a sellers market having 3 months of supply or less and a normal/balanced market between 4 to 6 months of supply. Last month, we were half way towards a balanced housing market.
That’s based on MLS listed properties. In reality, it’s a little higher as there are non-listed new construction units for sale that’s not accounted for in the officially published NWMLS statistics.
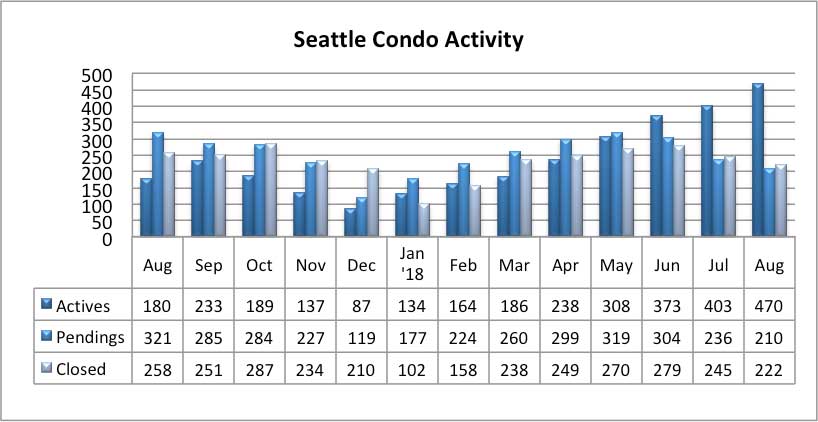
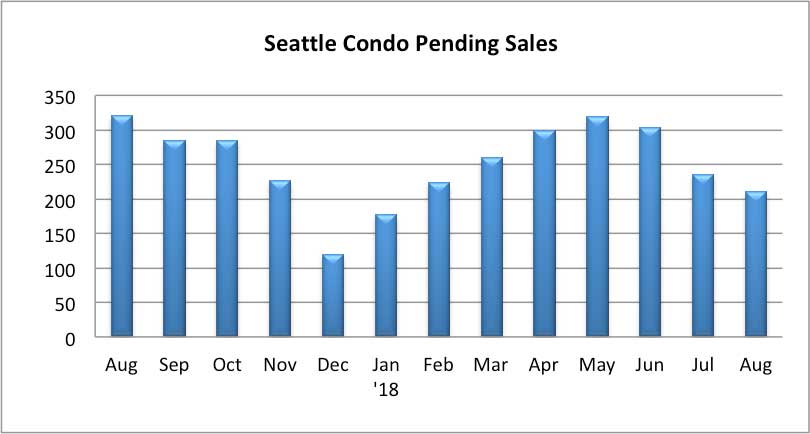
The rate of sales slowed in August, which is not unexpected given the cyclical nature of the Seattle’s condo market. There were 210 pending sales transactions (listings with accepted offers), reflecting a one-year decline of 34.6% and a one-month drop of 11%.
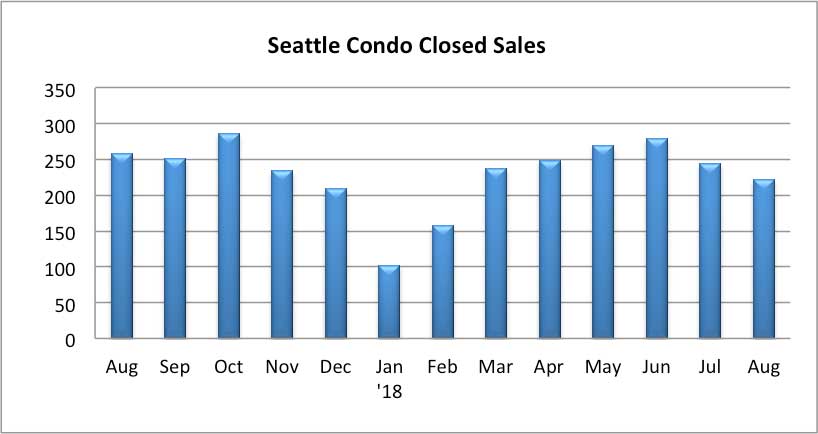
As with pending transactions, the number of closed condo sales also declined, reducing 14% year-over-year and 9.4% from July.
While we would normally see sales activity taper off, there is a chance of an increase given the greater opportunities for buyers. If you’ve been on the fence, it might be time to reconsider jumping back into market.
Sellers, on the other hand, will need to adjust to a rapidly shifting market place. Fortunately, our team of experienced condo specialists can guide sellers through the market.
Source: NWMLS. Some figures were independently compiled by SeattleCondosAndLofts.com and were not published by the Northwest Multiple Listing Service.
________________________
© SeattleCondosAndLofts.com


