Seattle Condo Market Update August 2026

August was a lackluster month for Seattle’s condo market. Inventory continued to rise as condo selling prices and unit sales trended down for the month.
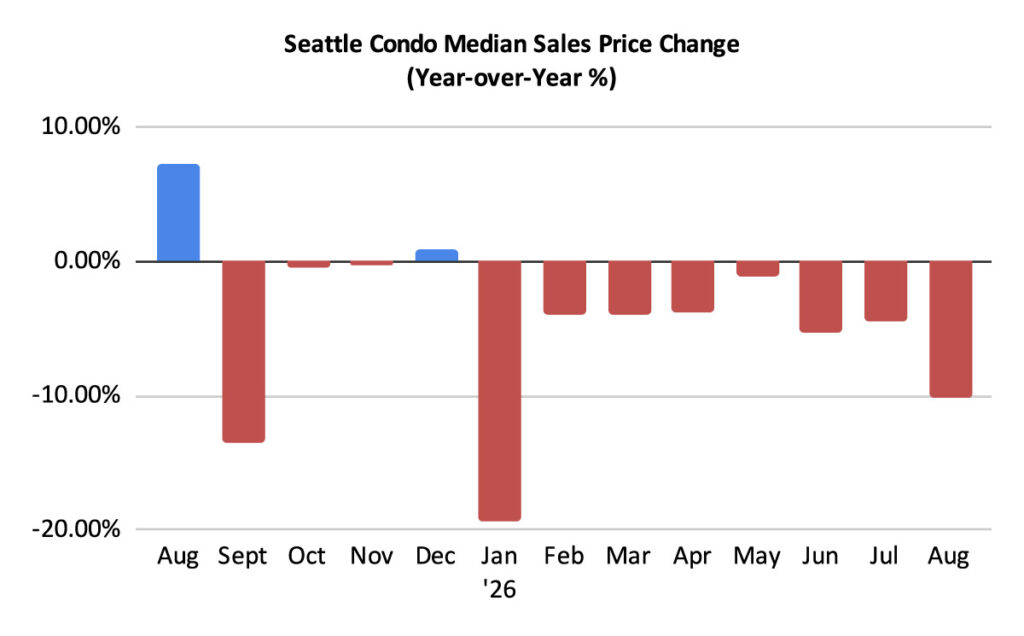
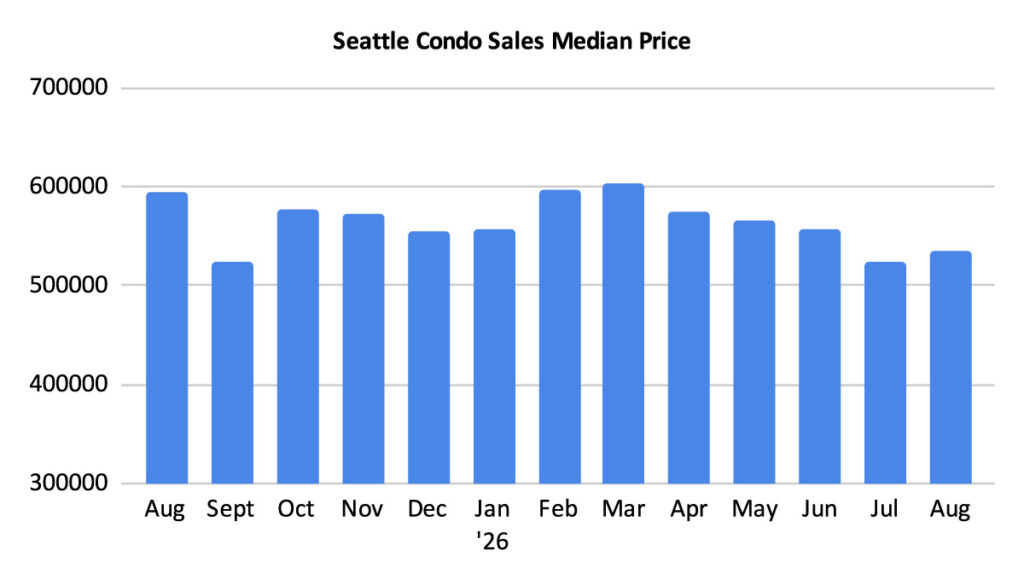
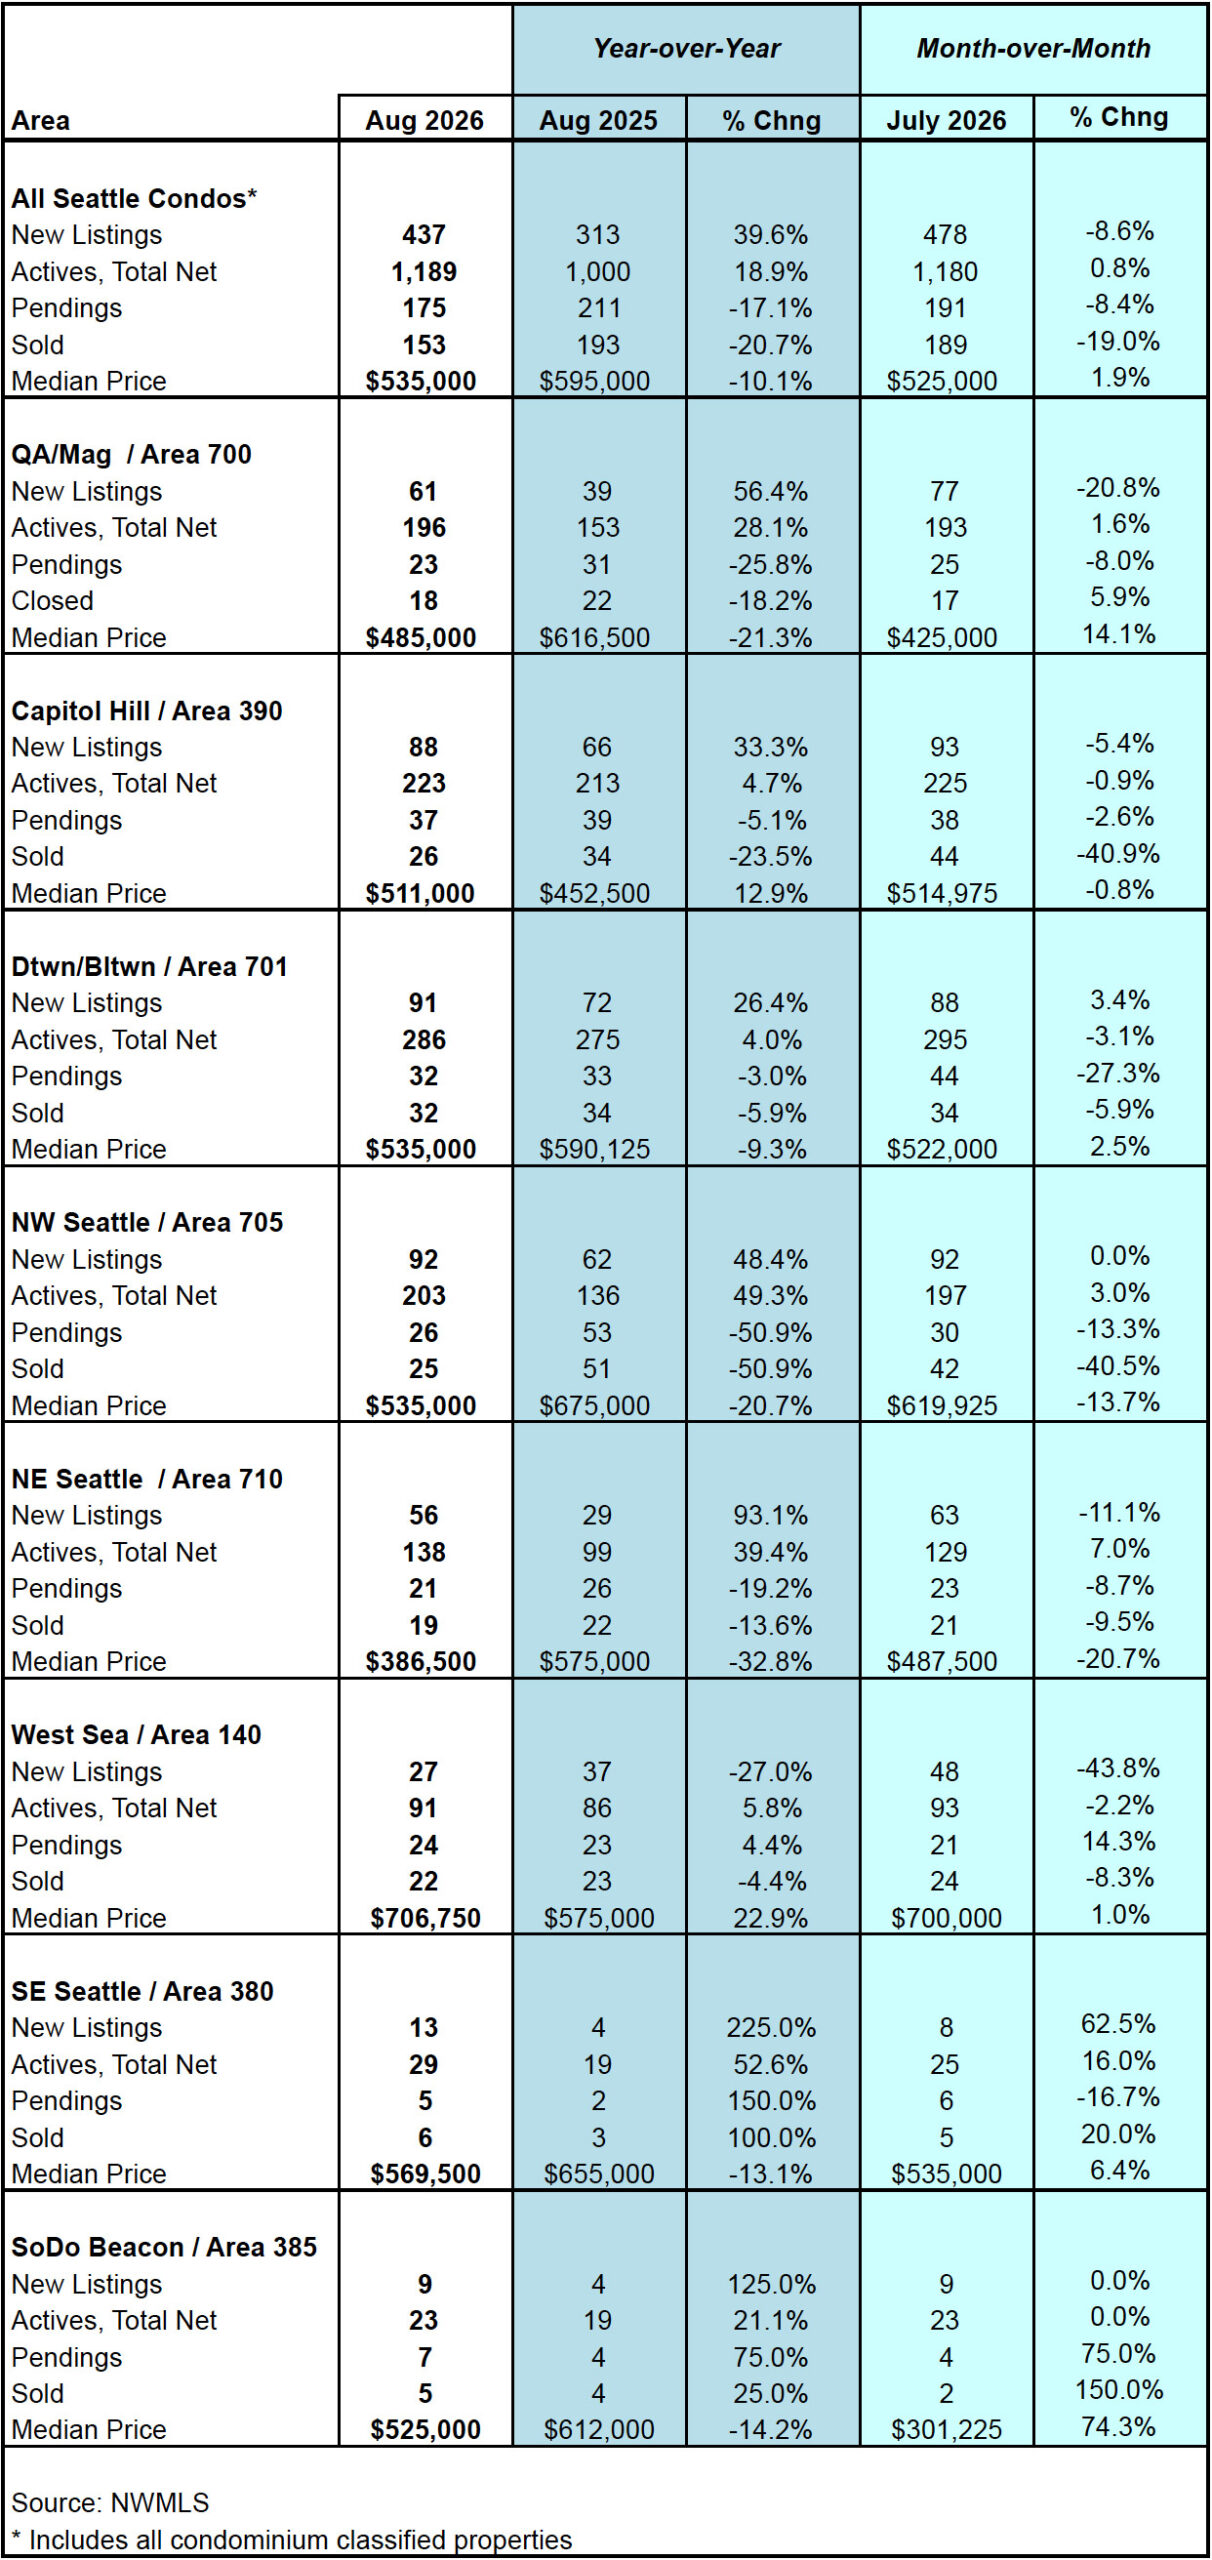
The Seattle citywide median sales price for condos was $535,000 in August. That represented a year-over-year decrease of 10.1%, the 8th consecutive monthly declined compared to the same periods in 2025. Though, it exhibited a slight 1.9% increase over the previous month.
While Seattle reflected depressed selling prices overall, there were a a couple of NWMLS neigbhorbood areas that saw increases in their year-over-year median selling prices: West Seattle (+22.9%) and Capitol Hill / Central (+12.9%). The rest of the city, however, saw decreases. Click here to view complete neighborhood results.
The NWMLS has a broad classification for condominiums. It lumps traditional condo units with non-traditional condo properties such as townhomes, accessory dwelling units (ADU), detached accessory dwelling units (DADU), condoized single family houses, as well as moorage and deeded parking spaces.
The non-traditional condo properties are typically newer and higher valued. As a result, they skew the statistics for traditional condo units. Excluding non-traditional condos, the median selling price for traditional condo units was $475,000. That reflected a one-year decline of 10.4%, but also a 2.2% increase over the prior month.
Non-traditional condos had a median selling price of $728,000 in August. That exhibited a year-over-year and one-month decrease of 8.9% and 2.3%, respectively. They also comprised 31.5% of all condo sales in August. Presently, they account for 22.5% of the current active listings in Seattle.
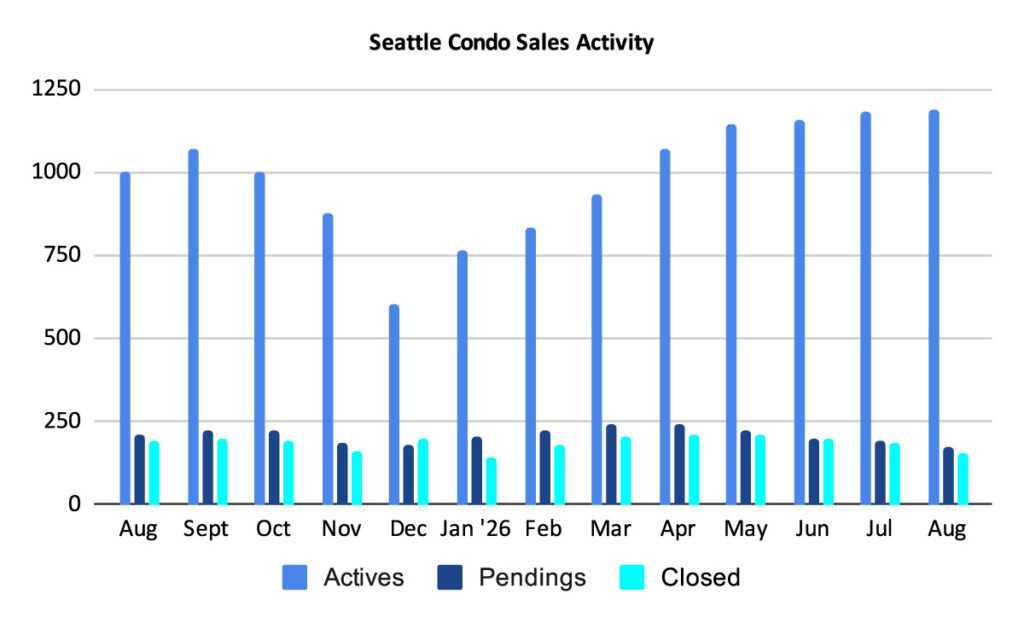
The number of active Seattle condos listed for sale in the NMWLS grew 18.9% compared to last August and 0.8% over the prior month. We ended the month with 1,189 listings, an increase of only 9 units. However, it’s the most listed for sale in the NWMLS going back to October 2010.
Seattle started the month with 1,180 units for sale with sellers adding another 437 units throughout the month for a total of 1,617 for sale. Of that number, 428 units came off the market as a result of sales, were cancelled or had expired, were rented out instead, or for other reasons. That left 1,189 units at month’s end.
New listings came on the market at a decreasing rate. There were 478 new listings in July and 437 in August that resulted in a decrease of 8.6%. Though, that’s not surprising with Seattle’s seasonal real estate market. The number of active listings cyclically reduce from the end of summer through the end of the year.
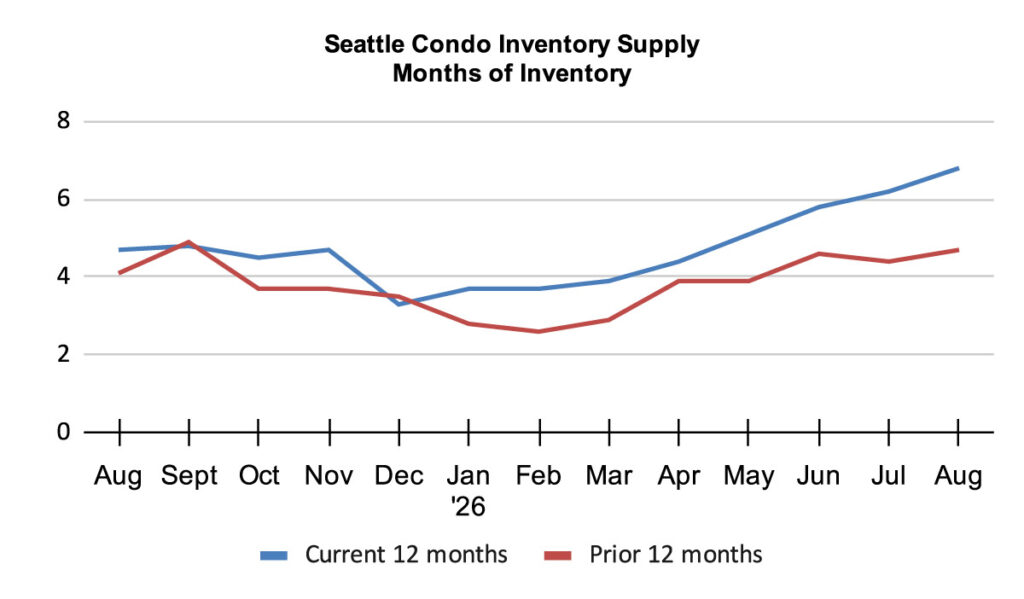
The Seattle condo inventory supply rate rose to 6.8-months of supply, its highest level since 2010. Seattle, as a whole, is essentially in a buyer’s market.
The inventory supply rate categorizes the current market environment. A rate of less than 4-month of supply is considered a seller’s market. A rate between 4 to 7-months is a normal or balanced market. And, a rate more than 7-months would be a buyer’s market. We calculate the supply rate using pending sales transactions.
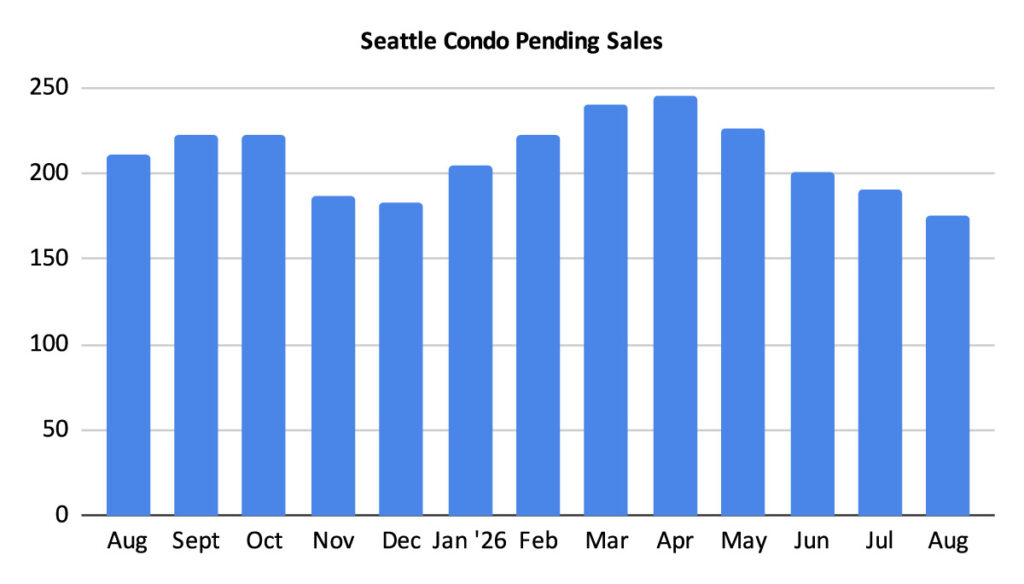
There were 175 pending sales transaction in August, reflecting a 17.1% decrease compared to the same period last year, as well as an 8.4% drop from the previous month.
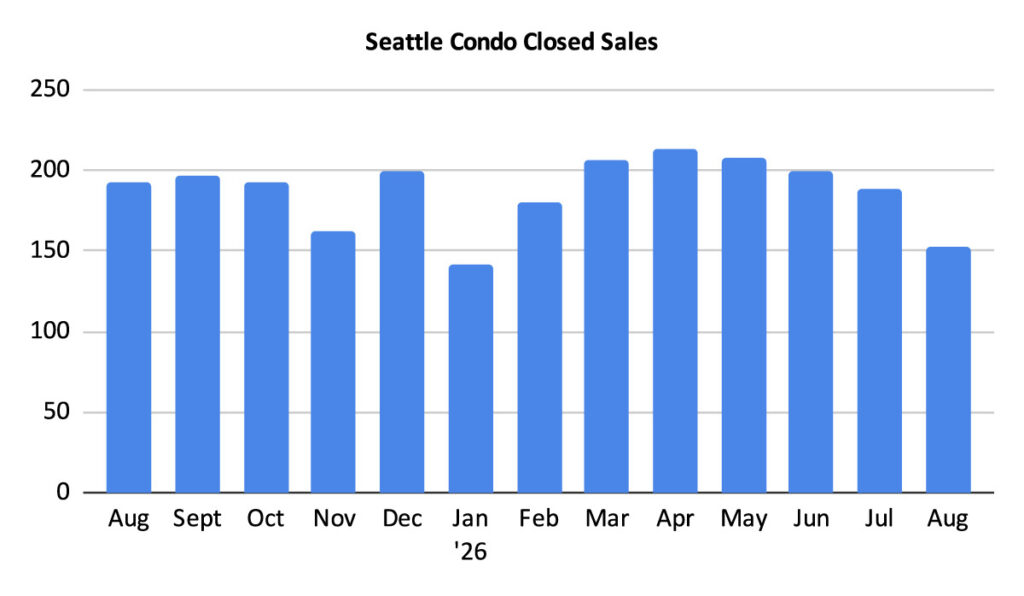
The number of closed condo sales reduced significantly, reducing 20.7% year-over-year and 19% from the prior month to 153 units.
As we head towards the third quarter to close out 2026, we will see few sales. The autumn / fall season is the slowest period for real estate in Seattle.
Seattle Condo Market Statistics August 2026
Source: Northwest Multiple Listing Service. Some figures were independently compiled by Seattle Condos And Lofts and were not published by the NWMLS.
© SeattleCondosAndLofts.com