Seattle Condo Market Recap June 2026

The start of summer brought sunny, warm weather to the Pacific Northwest, but it put a damper on Seattle’s condominium market. The June results exhibited a lackluster performance for the condo segment. Inventory increased while condo sales activity and selling prices fell.
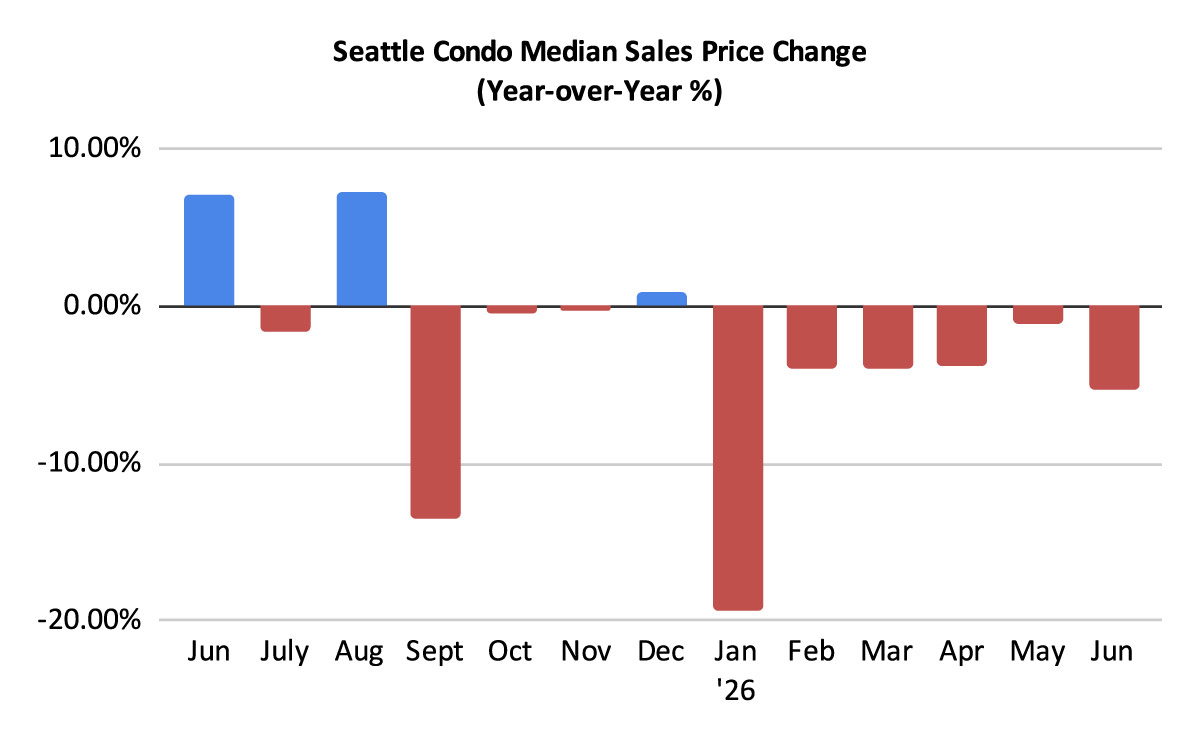
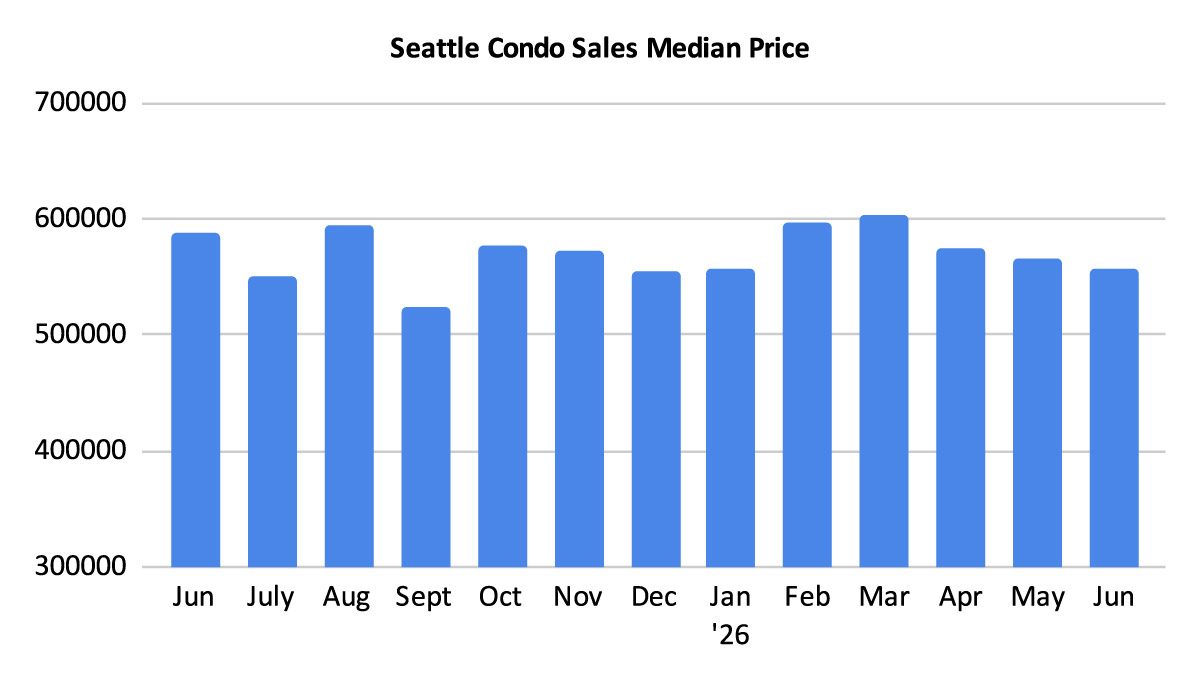
In looking at Seattle as a whole, the citywide condo median sales price in June was $557,475. That reflected a year-over-year (YOY) and a month-over-month decrease of 5.4% and 1.6%, respectively. It was the 6th consecutive month of YOY decline in the median sales price. Most of the decreases occurred in the condo-dense areas of Downtown/Belltown (-15.6%), Capitol Hill / Central Area (-3.2%) and Queen Anne (-10%), as well as Northeast Seattle (-17.6%).
However, it was not all grim news as Northwest Seattle (+3.3%), West Seattle (+13.1%), Southeast Seattle (+44.4%) and South Seattle (+7.5%) all reflected YOY increases in their median selling prices. For complete NWMLS neighborhood area breakdown, see this table at the end of the post.
These figures are based on the total number of sales and properties classified as “condominium” by the Northwest MLS, which has a very broad definition. The NWMLS condominium category include the traditional condo flats, as well as non-traditional condo properties: condoized single family houses, townhomes, accessory dwelling units (ADU), detached accessory dwelling units (DADU), floating homes, moorage and deeded parking spaces.
Altogether, non-traditional condos comprised 24.5% of all condo sales in June. That’s one out of every four. They had a median sales price of $799,999 last month, essentially on par with the $799,000 from June of last year and with the prior month.
On the other hand, traditional condos had a median sales of $484,999 last month. That’s an increase of 1% over May, but a 5.3% decrease from last June.
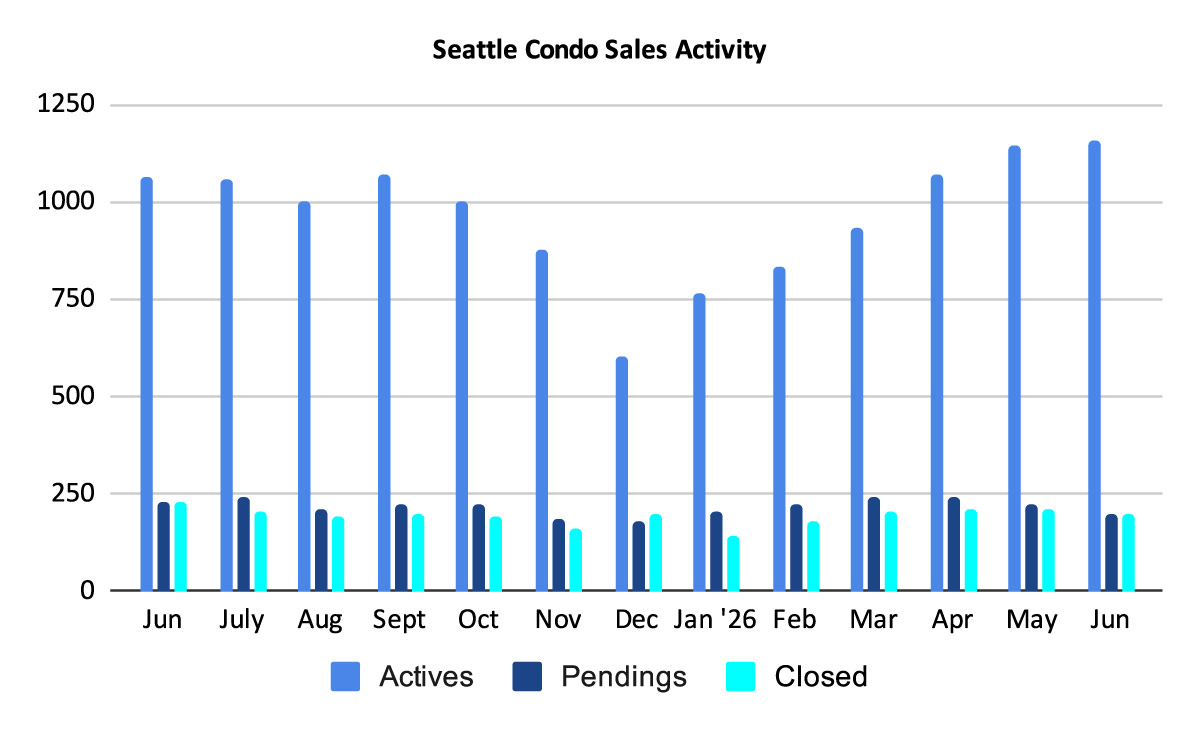
Not surprisingly by now, Seattle’s condominium inventory continued rising last month. We ended June with 1,156 units for sale. That’s 8.7% more YOY, but only 1% more than we had in May.
That said, however, new listings were added at a decreasing rate. Sellers listed 435 units for sale in June, reflecting a 2.9% decrease from the same period last year and 11.6% fewer than from the prior month. Fewer sellers are selling.
Seattle started June with 1,144 units listed for sale in the NWMLS. To that, sellers added 435 new listings for a total of 1,579 units available throughout the month. From that total, 423 came off the market for various reasons — being sold, rented out, or the listings expired or were cancelled — leaving the 1,156 at month’s end. Seattle’s condo net inventory only grew by 12 units.
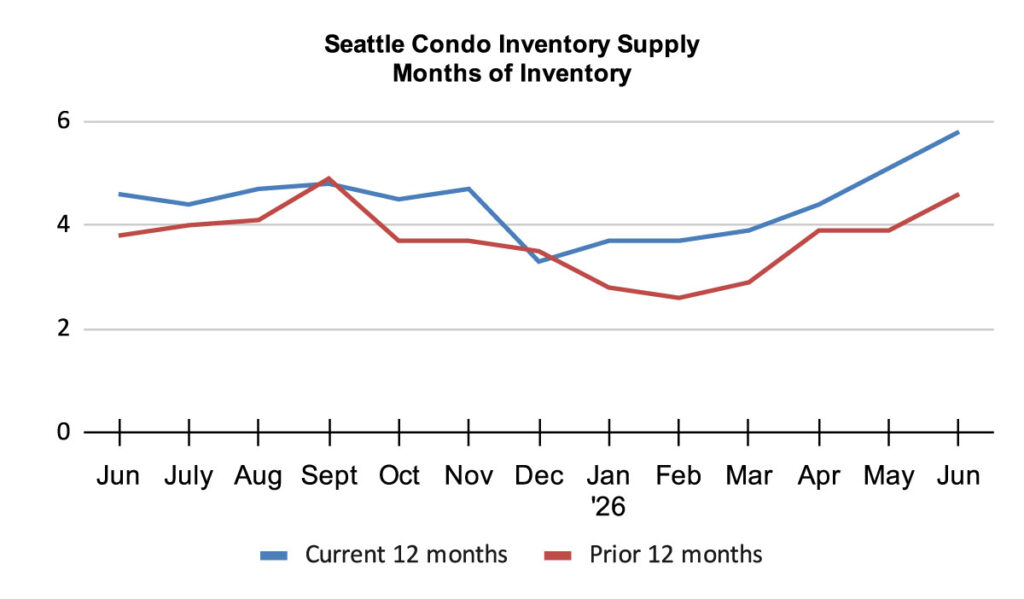
Those 12 units combined with lackluster sales resulted in a rising inventory supply rate to 5.8-months of supply. That reflects a solid balanced condo market.
The inventory supply rate categorizes the current market environment. A rate of less than 4-month of supply is considered a seller’s market. A rate between 4 to 7-months is a normal or balanced market. And, a rate more than 7-months would be a buyer’s market. We calculate the supply rate using pending sales transactions.
However, buyers and sellers may experience differing conditions with Seattle’s neighborhood and price point micro-markets. For example, looking just at neighborhoods, the downtown area reflects a buyer’s market with 8.7-months of supply as does Queen Anne / Magnolia with 8.3-months. Buyers may encounter more favorable selling prices and terms, while sellers may face longer market timeframe and depressed values. Fortunately, the rest of the city sits comfortably in the balance / normal market zone.
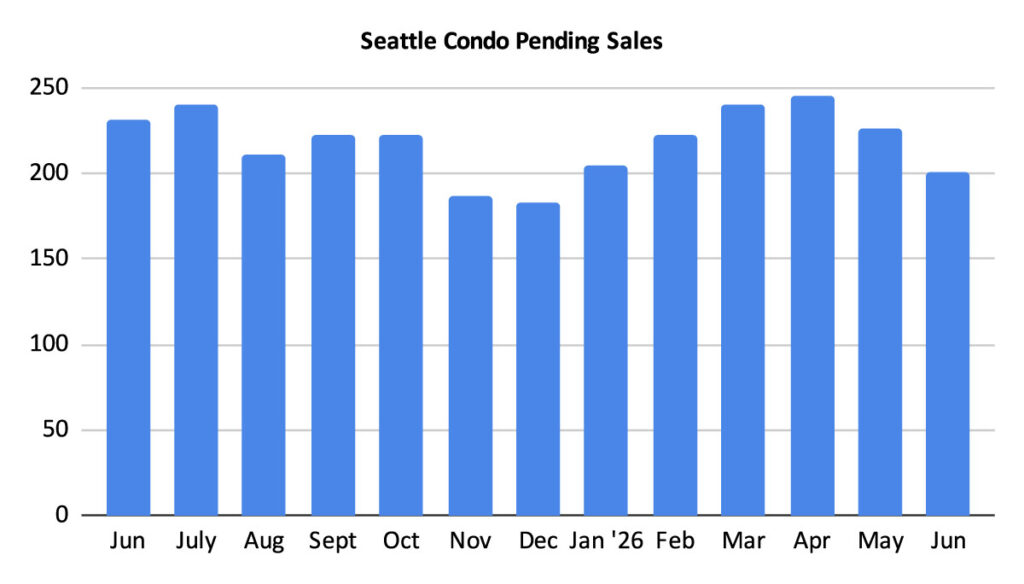
The number of listings is one factor in calculating the supply rate. Another is sales volume, and that has been trending downwards. There were 201 pending sales transactions (listings under contract in escrow) in June. That was 13% and 11.1% fewer than we had last June and from the prior month, respectively.
For the most part, the largest segment of condo buyers are younger professionals, buoyed by the regions tech firms and medical field, empty nesters looking to downsize, and second home buyers. The current volatility with the local tech employment, and national and global tensions placing pressure on the financial markets that’s impacting investments, savings accounts and mortgage interest rates all play a role in buyers trepidation in buying a home. Many are taking a wait and see posture.
There were 200 closed condo sales last month, exhibiting a one-year drop of 13% and a one-month dip of 3.8%. Closings typically lag behind pendings by a month so we’ll see the number of closings continue to decline.

In Summary
The summer sun maybe shining on Seattle but clouds hung over the condo market. Inventory continued to rise while sales activity slowed and prices fluctuated.
Seattle’s real estate market is cyclical and closely follow the seasons. The market’s peak is during the spring with strong sales velocity and rising prices. Then, the market settles down and plateaus during the summer months before trailing off during the fall. This year, it seems we may have skipped over the summer plateau part.
Seattle condo buyers and sellers experienced lackluster sales activity and softening values last month. For sellers, the market was more of a damper. But, for buyers, the transitioning market provides greater opportunities in terms of choices and better value.
Seattle Condo Market Statistics June 2026
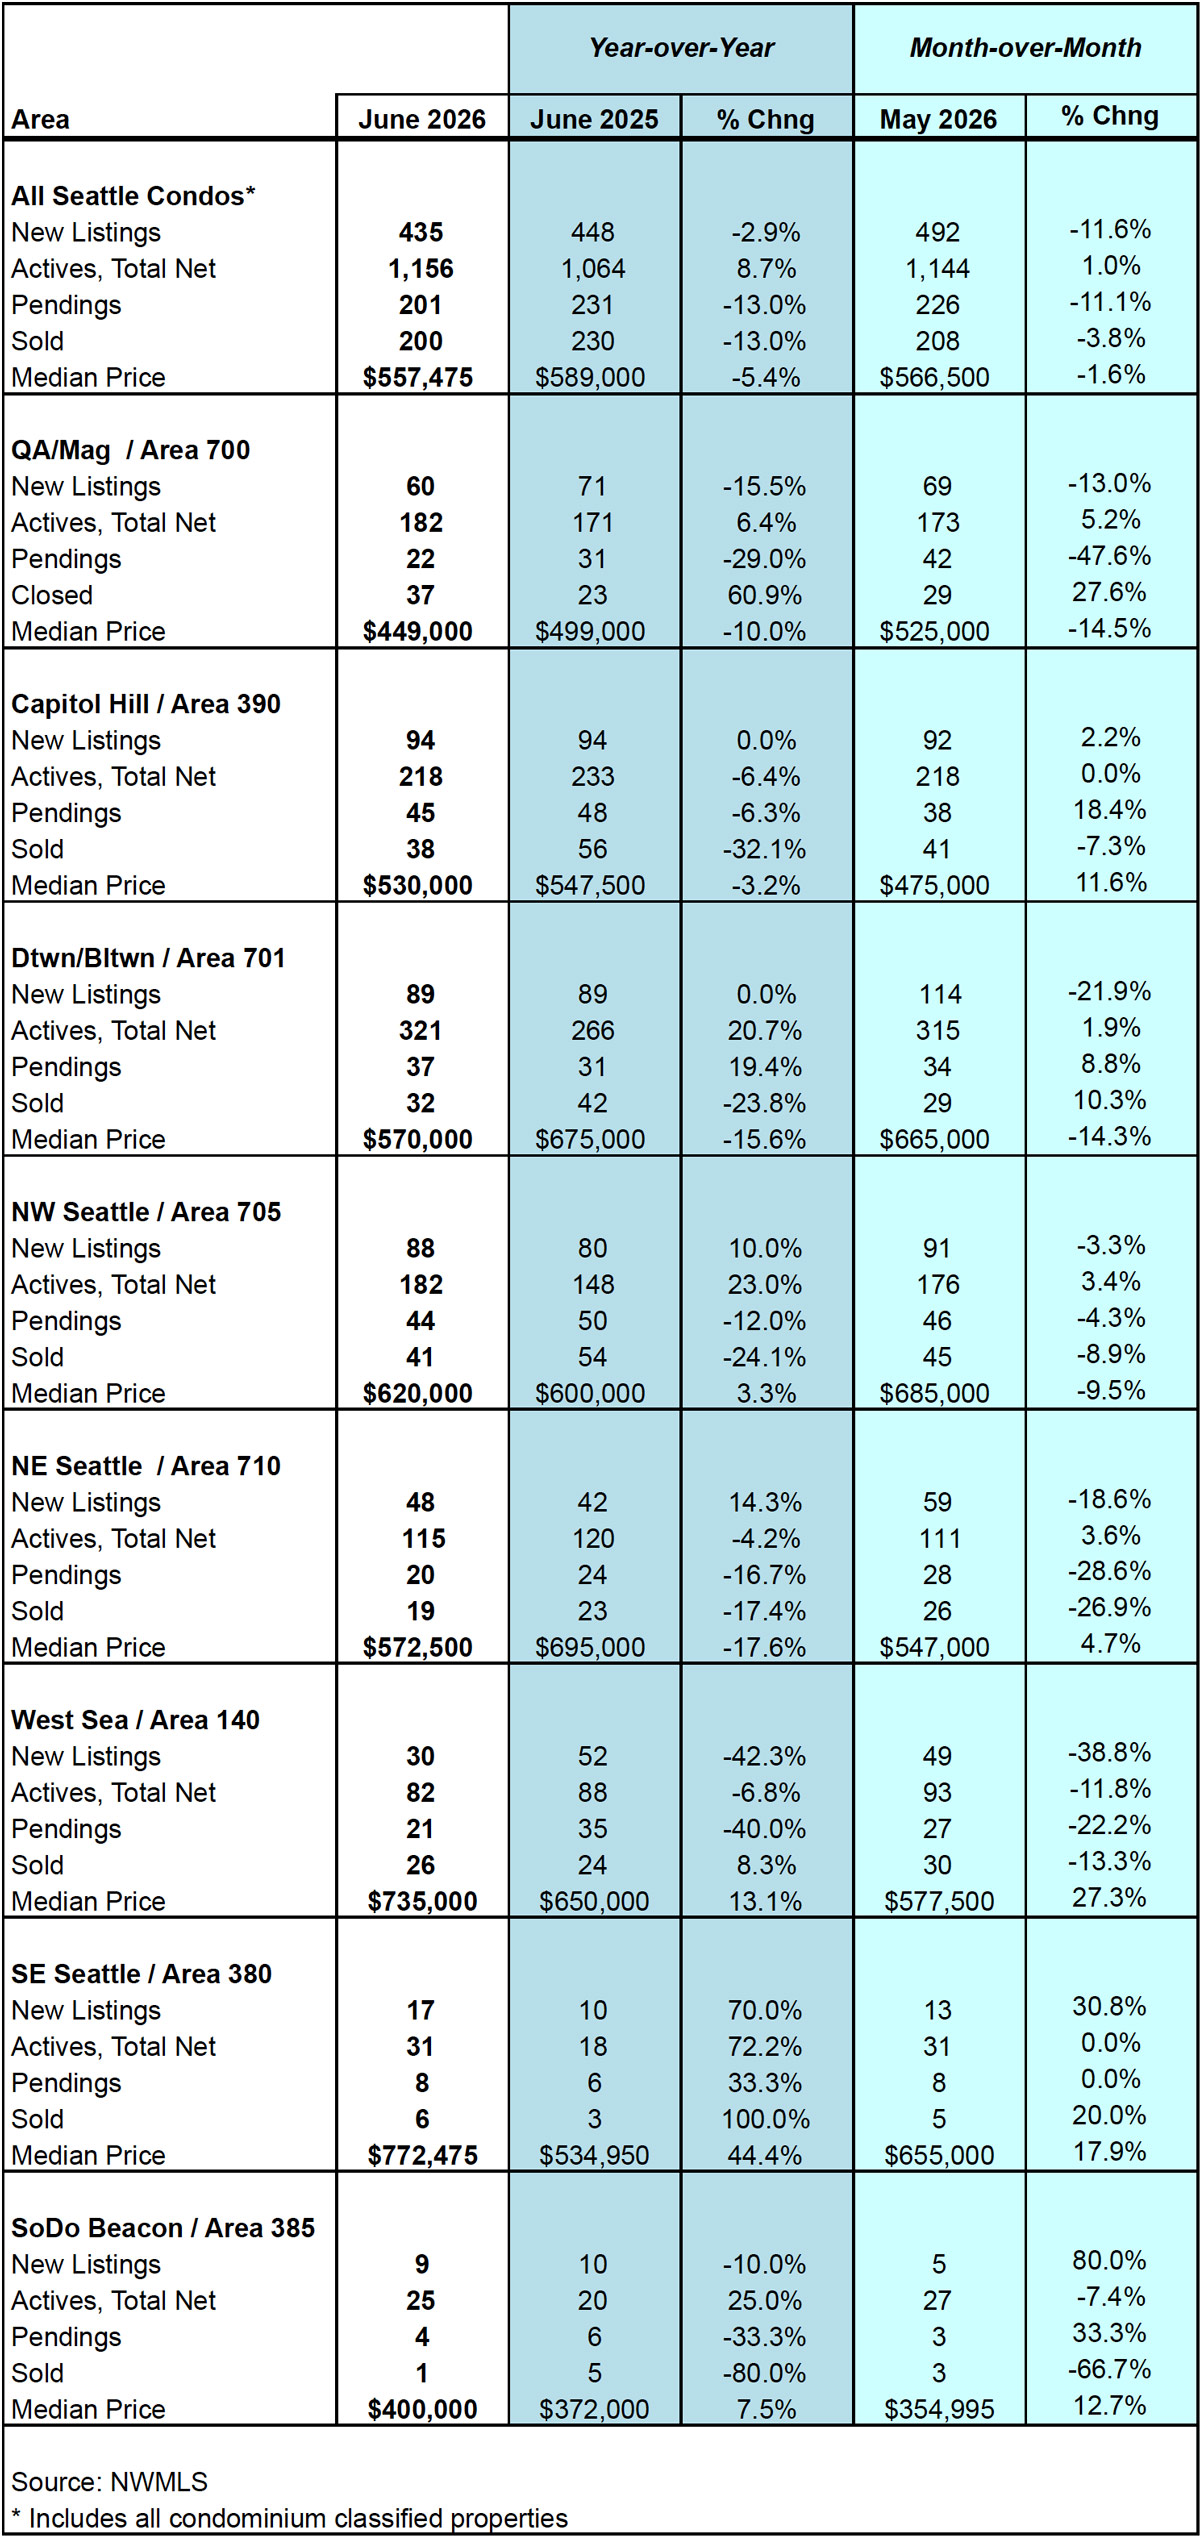
Source: Northwest Multiple Listing Service. Some figures were independently compiled by Seattle Condos And Lofts and were not published by the NWMLS.
© SeattleCondosAndLofts.com