Seattle Condo Market March 2026 Recap

The sunnier weather had a tepid effect as March showers soaked Seattle’s condo market. The warmth of Spring brought out the sellers, but buyers remained cool. The number of listings shot up while condo sales and selling prices mellowed out last month.
Selling Prices Hold Stead
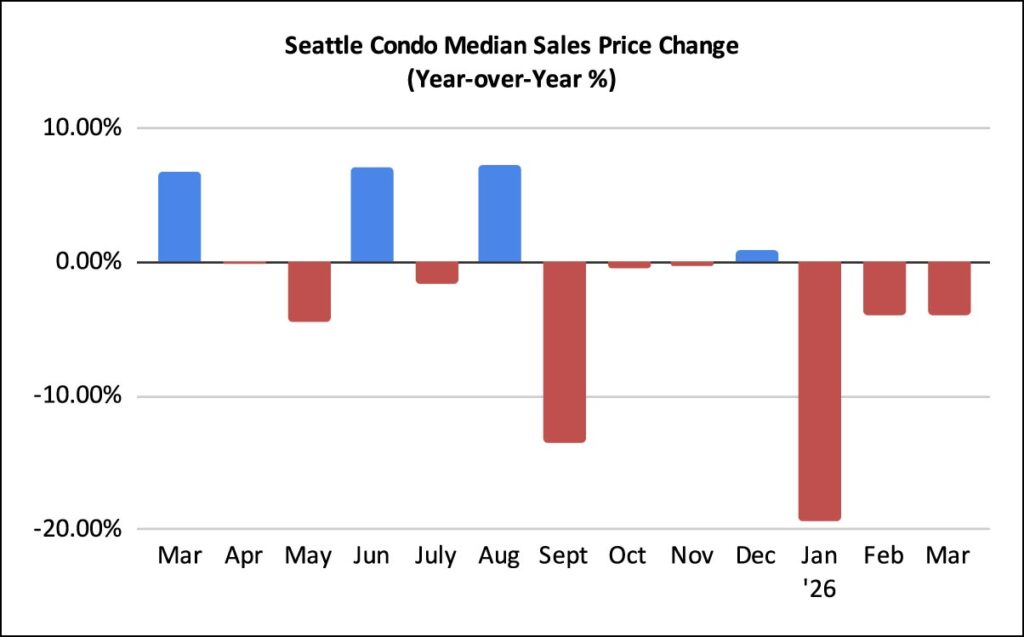
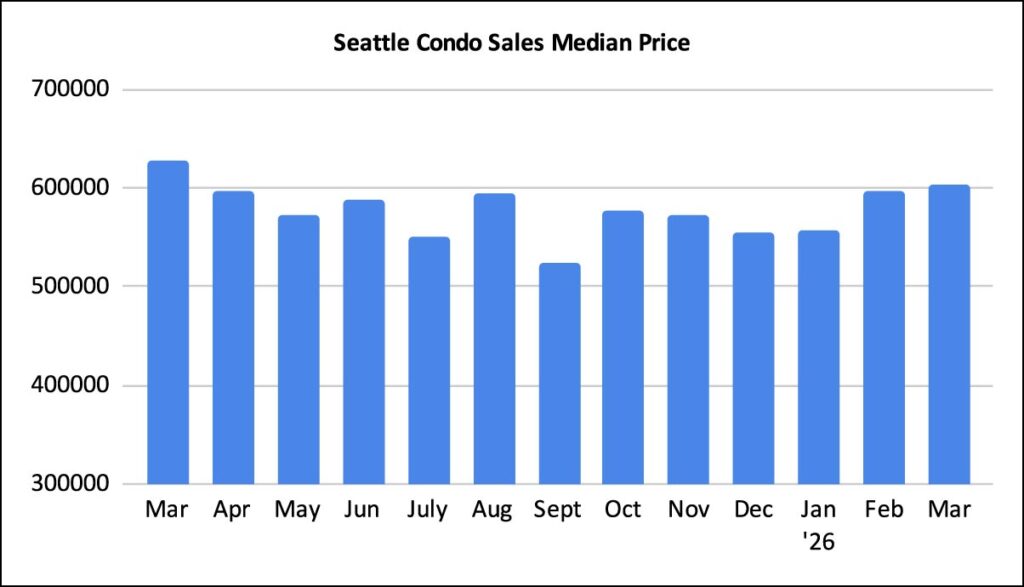
The Seattle citywide condo median sales price in March came in at $602,750. That reflected a slight one-month improvement of 1.1% over February. Though, that also exhibited a 4% drop year-over-year, marking three consecutive months of underperformance compared to last year.
That said, while the graph below looks unimpressive, the March 2026 median selling price was the 5th highest on record.
The median sales price is based on all properties classified as a condominium in the Northwest MLS, which has a broad definition that includes townhomes, condoized houses, accessory dwelling units (ADUs), detached accessory dwelling units (DADUs), boat moorage and deeded parking spaces. These are typically newer, larger and higher valued than the traditional condo unit in a multiple unit building. As a result, they skew the median upwards.
Looking at just traditional condo sales, the median sales price was $475,000 last month. That reflected a one-month and a one-year decrease of 2.5% and 2.1%, respectively. Traditional condo sales accounted for 63% of all condo sales in March.
Non-traditional condos had a median sales price of $779,950, a 5.5% drop from the prior month and a 2.5% dip from the same period last year. They represented 37% of all condo sales in March.
By NWMLS neighborhood area, the condo-dense areas saw decreased median sales prices. Capitol Hill / Central (-25%) lead the way and was followed by Queen Anne / Magnolia (-13.9%) and Downtown / Belltown (-12.4%). On the other hand, in the South end, small sample sizes and townhome sales propped up selling prices in South Seattle (+17.7%) and Southeast Seattle (+7.2%). View all neighborhood results.
Condo Listings Bloom
The Spring season is Seattle’s peak period for real estate, and this year is no exception. Sellers raced to take advantage bringing on an increasing number of units for sale. Seattle ended March with 936 condo listings, which was 17.3% more year-over-year and 12% more than the prior month.
We started March with 836 listings and sellers brought another 481 new listings to market throughout the month for a total of 1,317. The number of new listings in March exceeded the number sellers brought on last year by 11.9%, as well as February by 25.9%.
Of the total listings in March, 381 came off the market leaving 936 at month end. Listings came off the market due to unit sales, cancellations or expirations, being rented out or for other reasons.
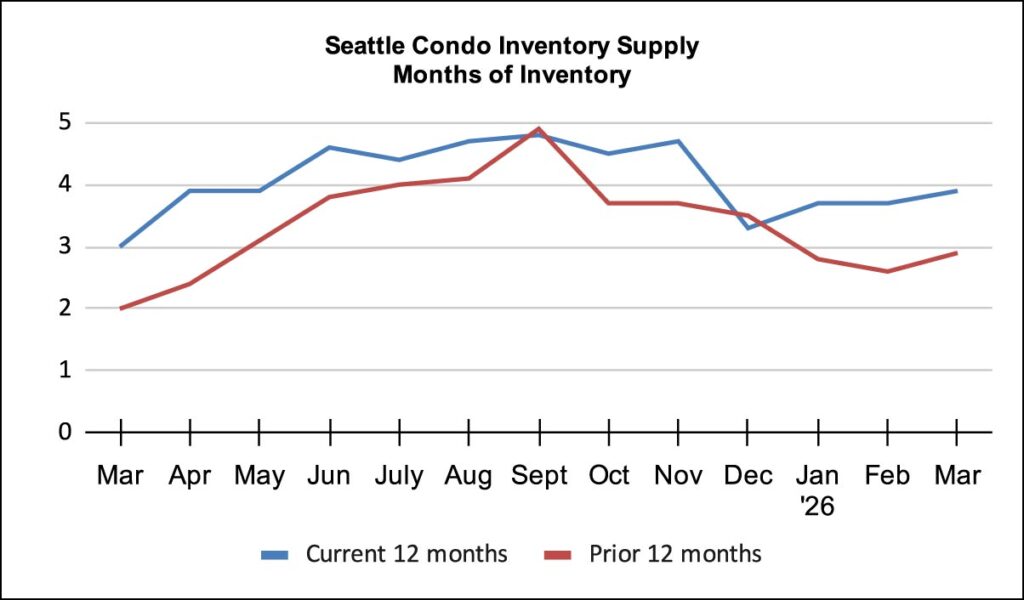
As expected with more listings for sale, Seattle’s condo inventory supply rate rose to 3.9-months of supply. This places Seattle in a balanced / normal market environment.
The inventory supply rate categorizes the current market condition. A rate of less than 4-month of supply is considered a seller’s market. A rate between 4 to 7-months is a normal or balanced market. And, a rate more than 7-months would be a buyer’s market. We use pending transactions when calculating the supply rate, though closed sales is also used.
Seattle is comprised of neighborhood micro markets with varying supply and demand levels. For instance, Downtown / Belltown has a supply rate of 8.2-months of supply, which is firmly in a buyer’s market.
On the other hand, Northwest Seattle and West Seattle have supply rates of just 2.4-months and 2.5-months, respectively. That is typically indicative of a tighter market.
However, the type of properties have differing conditions as well. For instance, in Northwest Seattle, traditional condos are reflective of a balance market with 4.8-months of supply, while non-traditional condos (e.g. townhomes, DADUs) reflect a tighter, seller’s market at 1.9-months. Thus, condo buyer may encounter more favorable terms and pricing while townhomes will favor sellers.
Condo Sales Spring Forward
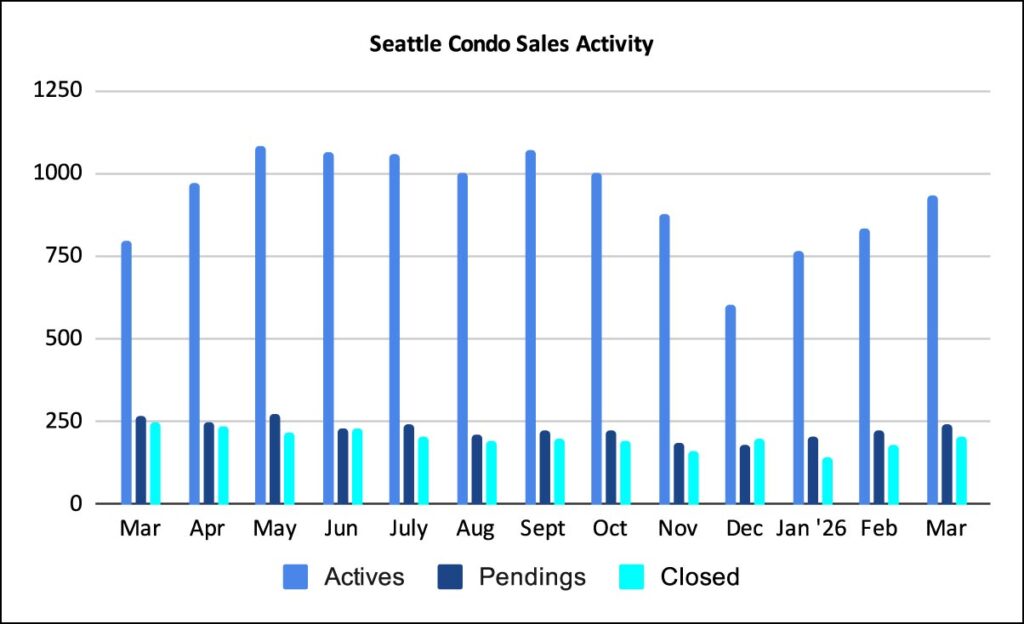
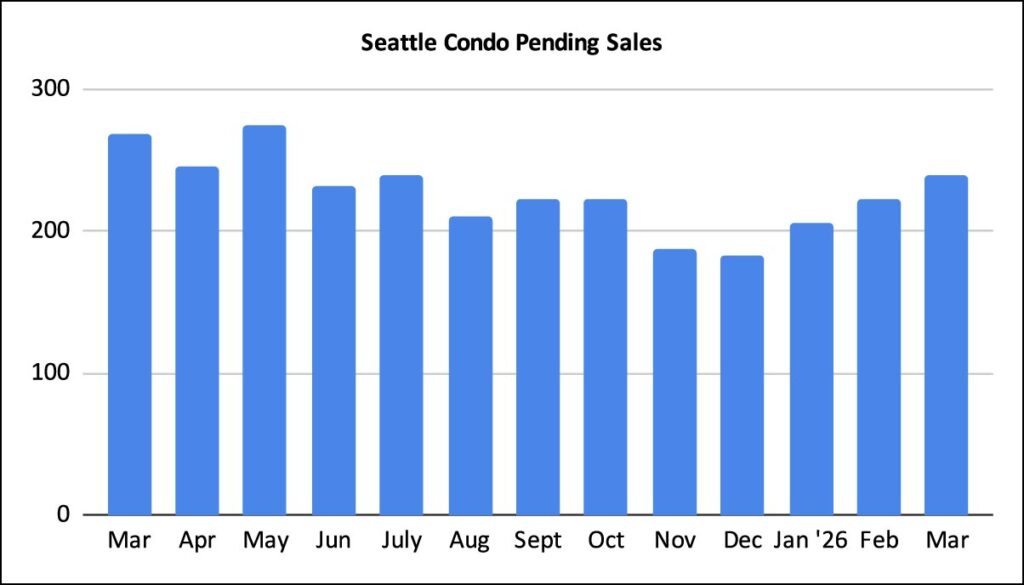
Condo sales improved over February by 7.6% with 240 units under contract in pending status, which is what we’d expect with the spring market. However, that also exhibited 10.5% fewer sales compared to last March.
The bump in mortgage interest rates in March may have impacted sales along with the current uncertainty with tech sector employment and global issues impacting the financial markets.
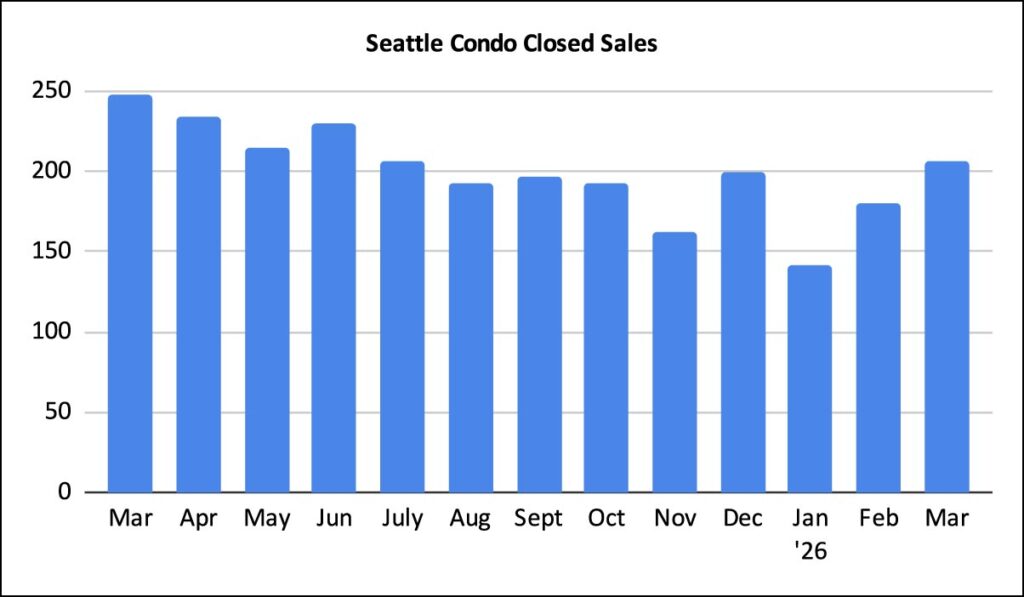
There were 206 closed condo sales in March, noting a one-month improvement of 14.4% over February and a year-over-year reduction of 16.9%. Closings lag behind pendings by a month or so, thus this should increase in April.
In Summary
Seattle’s condo real estate market is holding true to our cyclical pattern. Sales activity and selling prices blossom during the Spring season and March results bare that out. While that’s good news for a healthy marketplace, we’re underperforming 2025 levels across the board with the exception of the number of listings.
Factors such as the bump in mortgage interest rates in March, tech layoffs, global issues and financial volatility have impacted buyers decisions.
For traditional condo buyers, this presents opportunities with more inventory choices, tempered pricing levels, better purchase terms and negotiating position. This may be less true with small development townhomes and DADUs where the market is a bit tighter.
For Seattle condo sellers, the Spring season has always been the prime time for selling. While there is more competition from other sellers, the Spring season historically exhibits higher sales volume and higher selling prices compared to other times during the calendar year. Yes, you might experience longer selling times and even price reductions, but they are still typically higher than selling in the Fall.
Seattle Condo Market Statistics March 2026
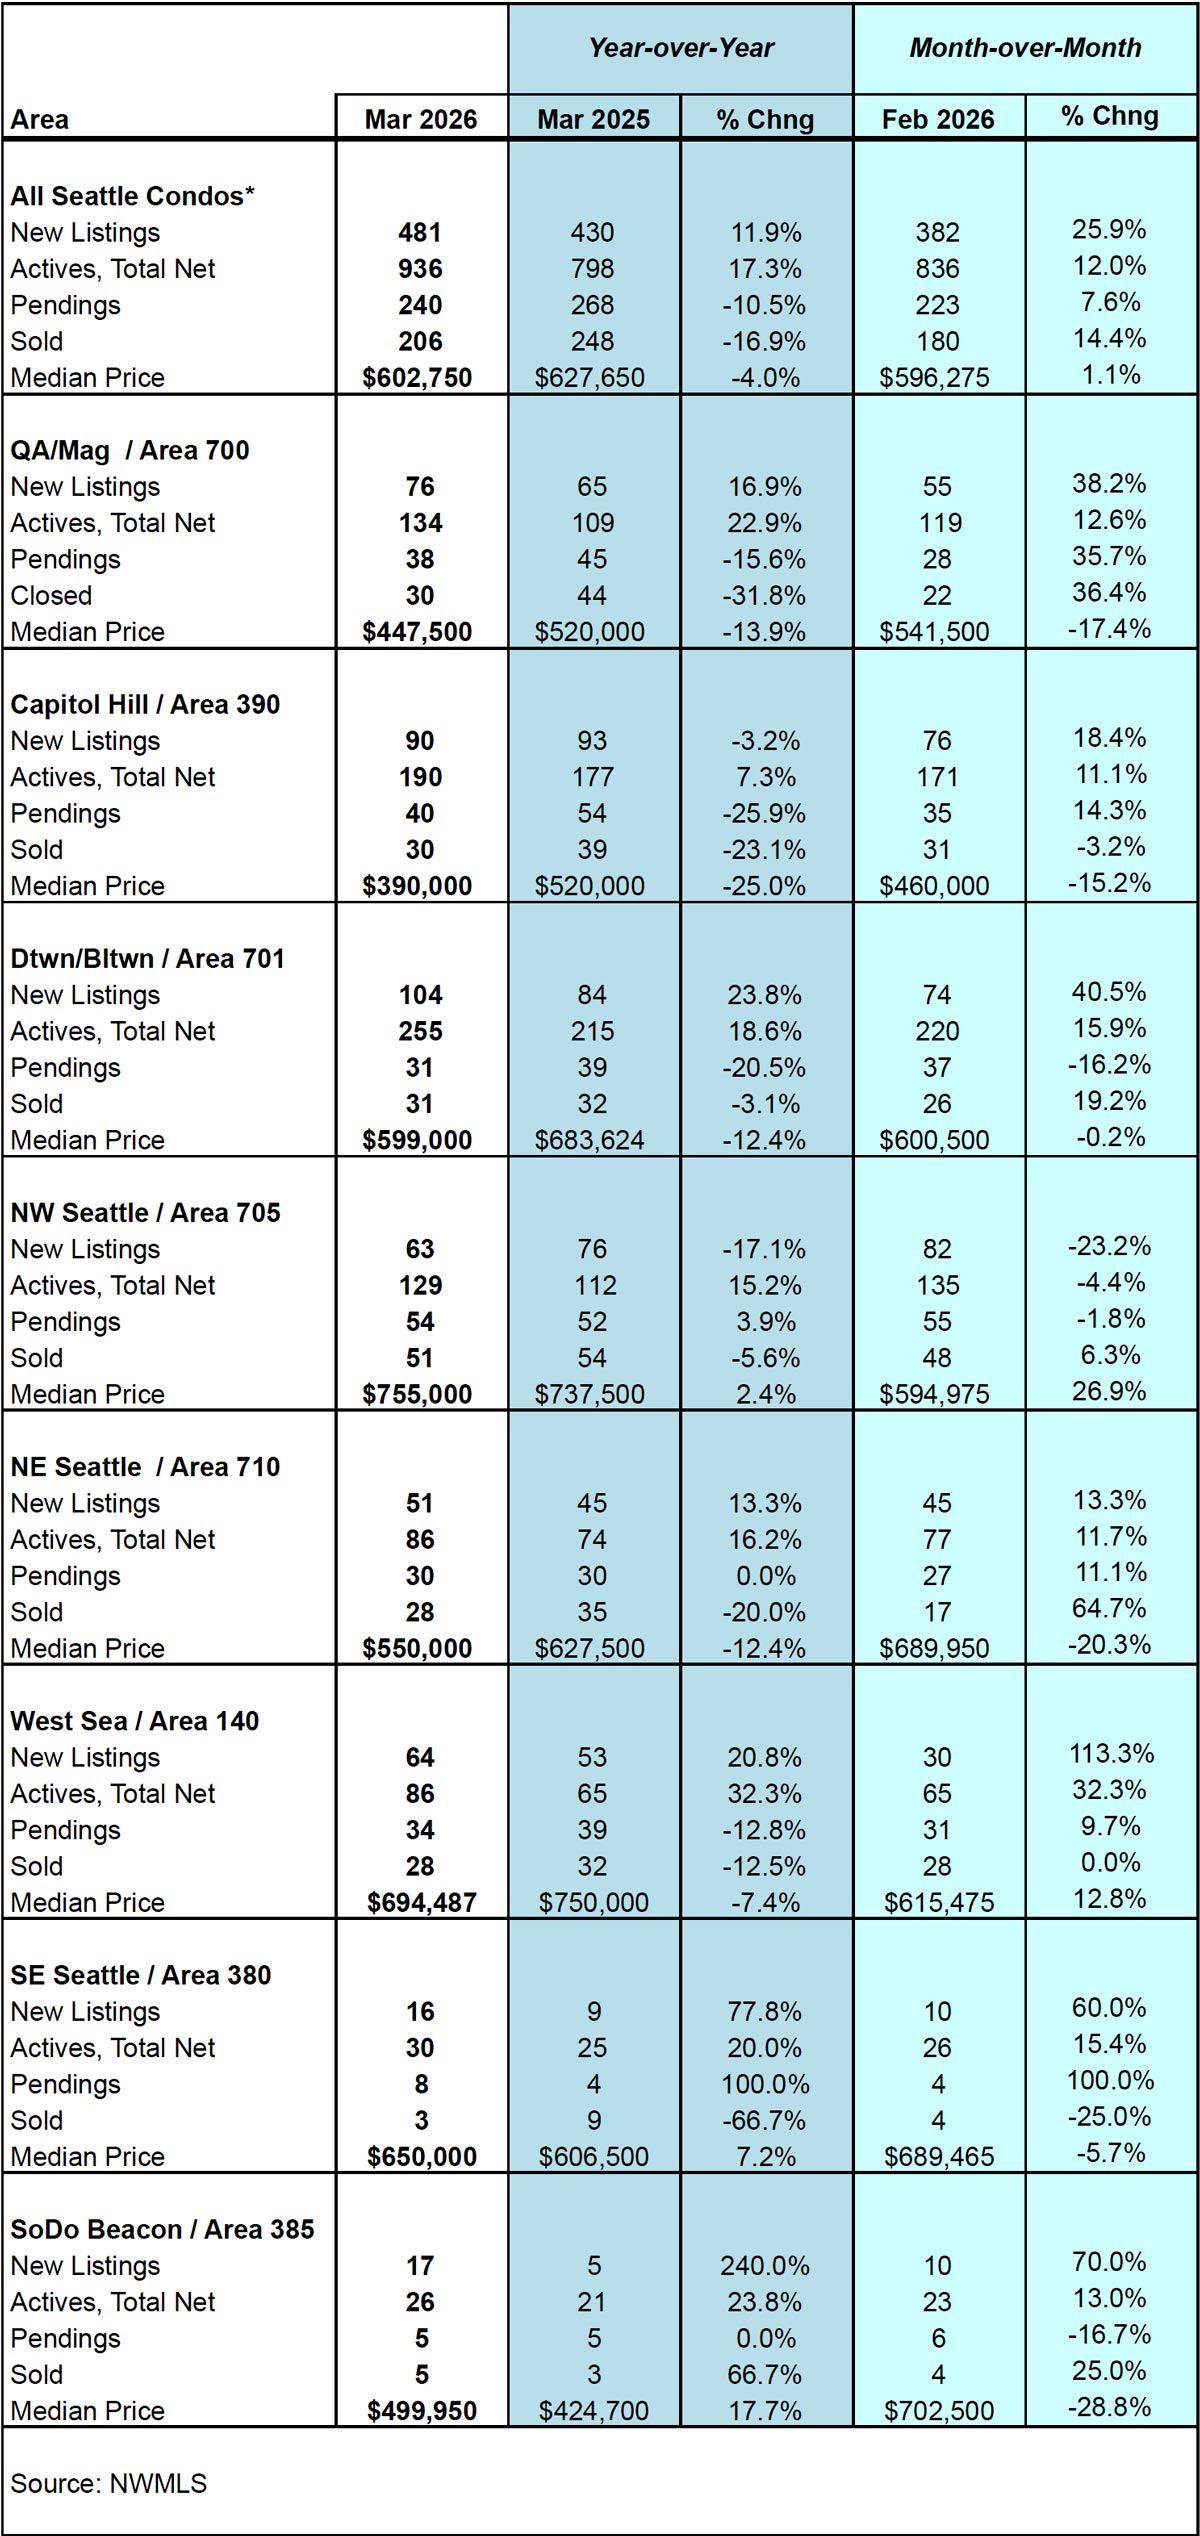
Source: Northwest Multiple Listing Service. Some figures were independently compiled by Seattle Condos And Lofts and were not published by the NWMLS.
© SeattleCondosAndLofts.com