February 2026 Seattle Condo Market Recap

February turned out to be fairly typical for Seattle’s condo market based on historic trends. Overall, progressing through the new year, Seattle condos reflected higher selling prices and increased sales activity. However, the market underperformed compared last February.
Prices Trend Upwards, But Below 2025 Levels
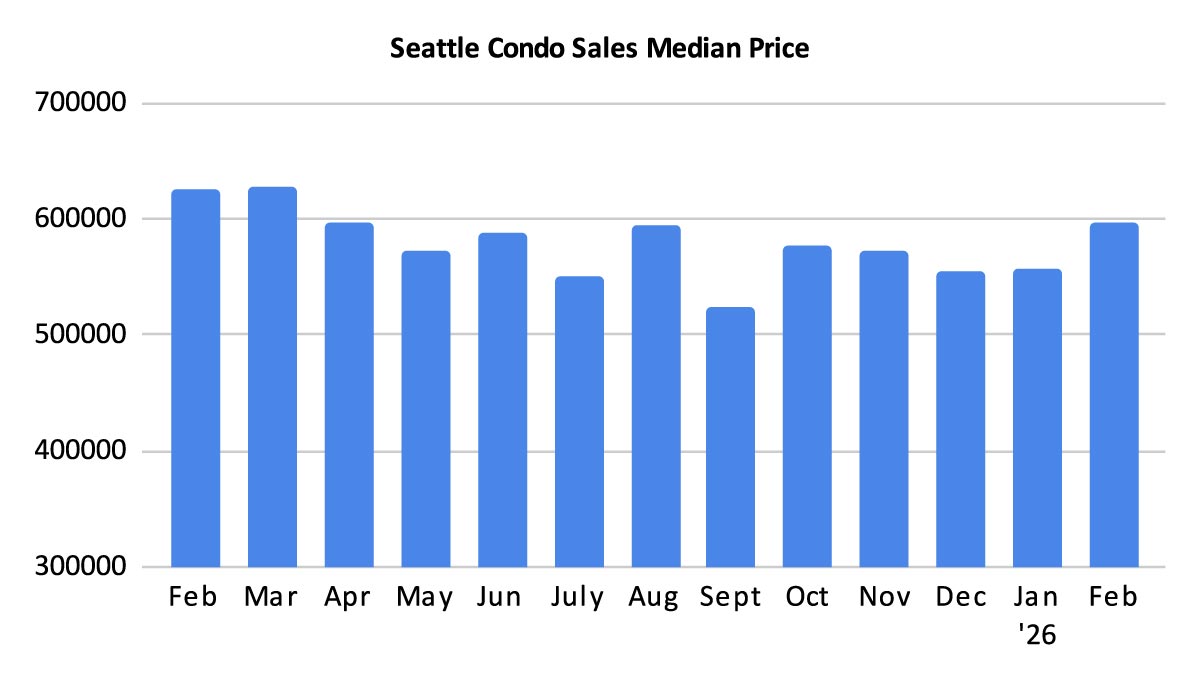
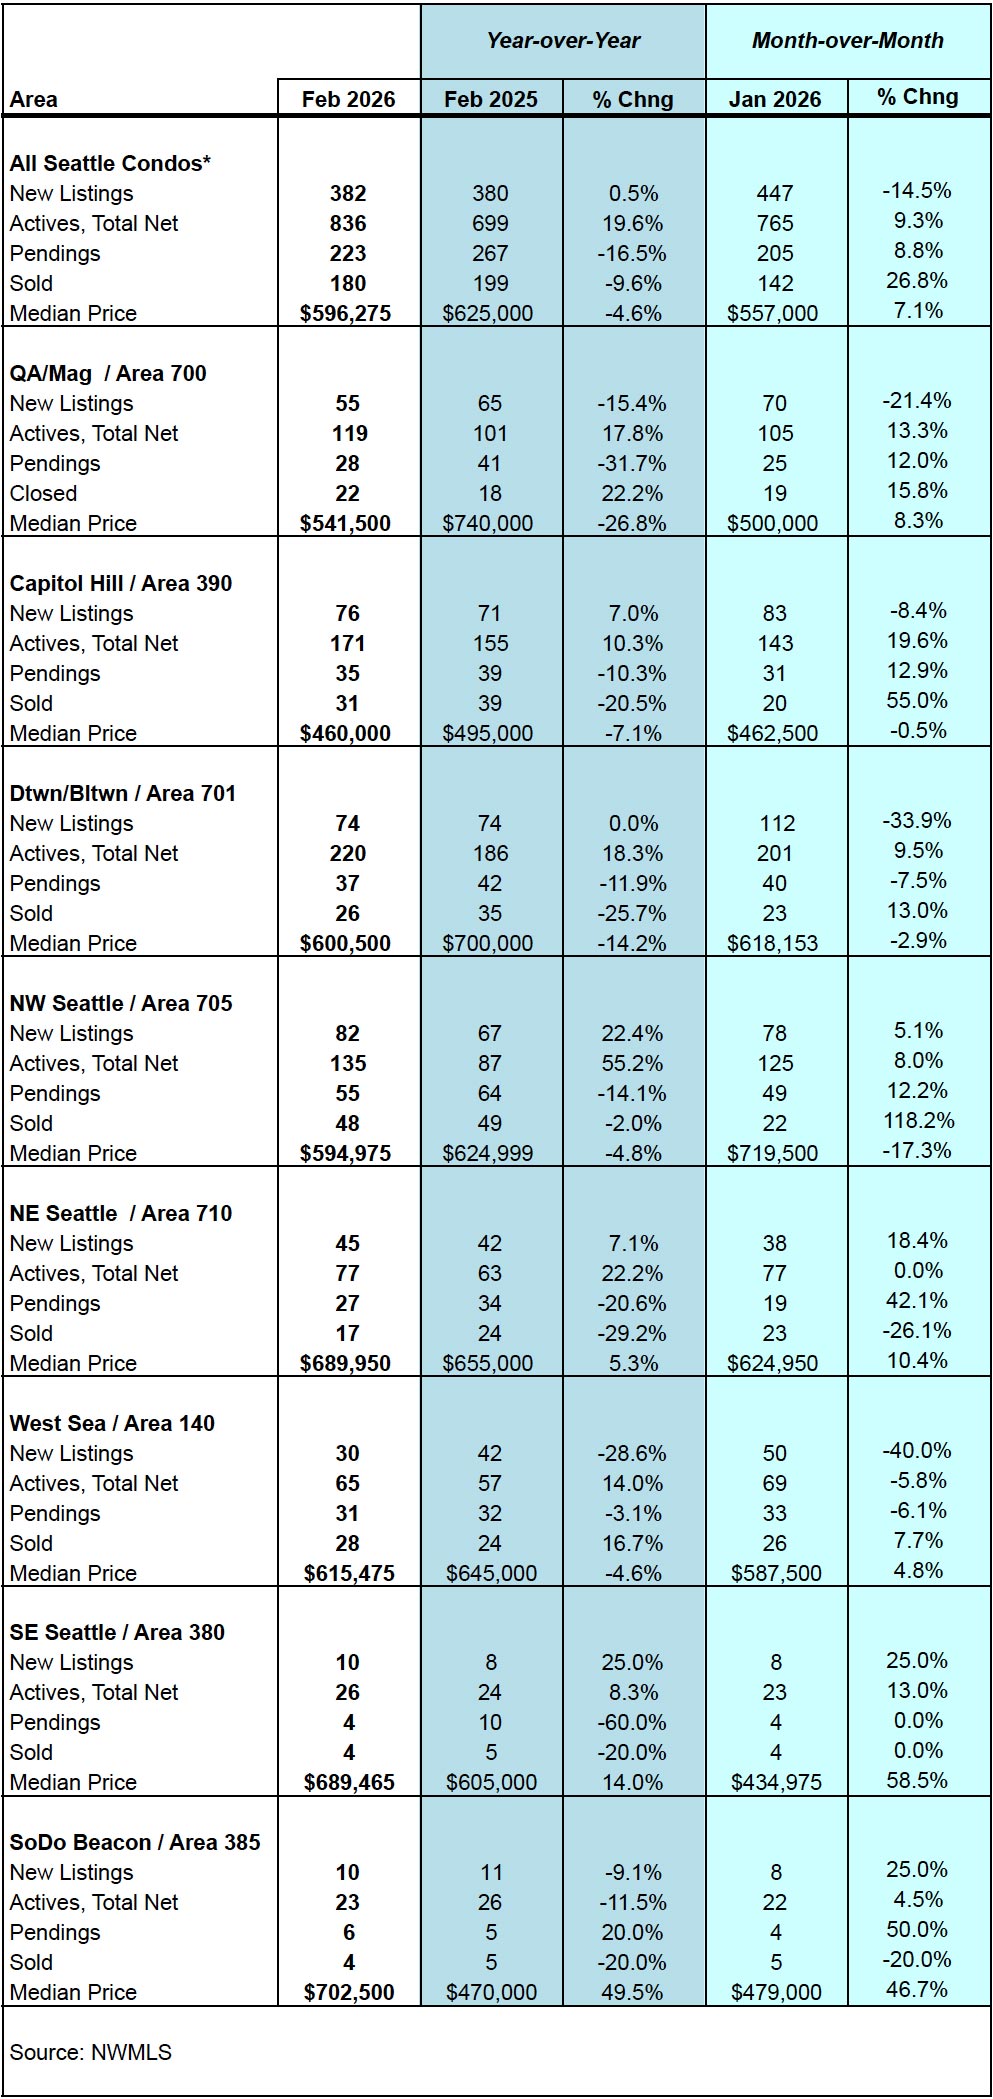
The Seattle citywide condo median sales price in February was $596,275. That reflected one-month increase of 7.1% over January. But, also, a year-over-year (YOY) decrease of 4.6% from last February.
By NWMLS neighborhood area, South Seattle (+49.5%), Southeast Seattle (+14%) and Northeast Seattle (+5.3%) were the only areas to realize increases in their selling prices in February. On the other end, Queen Anne / Magnolia (-26.8%) and Downtown / Belltown (-14.2%) led areas with declining values with double-digit decreases. Click here to view the complete neighborhood area statistics for February 2026.
This reflects the selling prices of all condominium-classified properties in Seattle. The NWMLS commingles various types of properties under its “condominium” category. It includes properties we normally consider to be non-traditional condos such as townhomes, condoized single family houses, accessory dwelling units (ADU), detached accessory dwelling units (DADU), boat moorage and deeded parking spaces. Typically, these are newer, larger and more expensive.
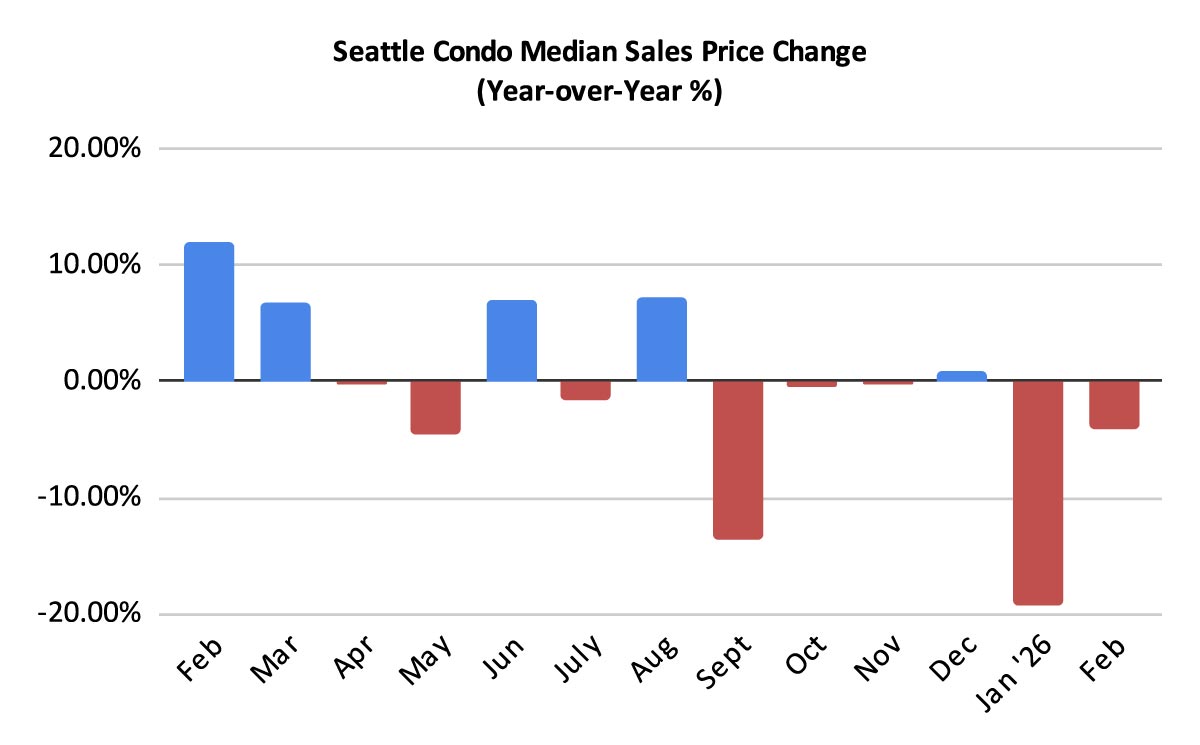
Selling prices were pretty solid when we break out the numbers between traditional and non-traditional condos. Traditional condos had a median sales price of $487,500 in February. That reflected a one-month increase of 9.6% and a YOY drop of 0.5%.
Non-traditional condos had a median sales price of $825,000, exhibiting both a YOY and MOM increase of 6.5%. They also comprised 35.3% of all condo sales in Seattle, essentially 1 in every 3 condos sales were non-traditional and they were predominately new townhomes.
Listings Increased at a Decreasing Pace
The number of listings increased as we’d anticipate transitioning from winter towards the spring. Cyclically, Seattle condo listings rapidly rise throughout the first quarter as we leave the dreary fall season behind with improving weather and renewal.
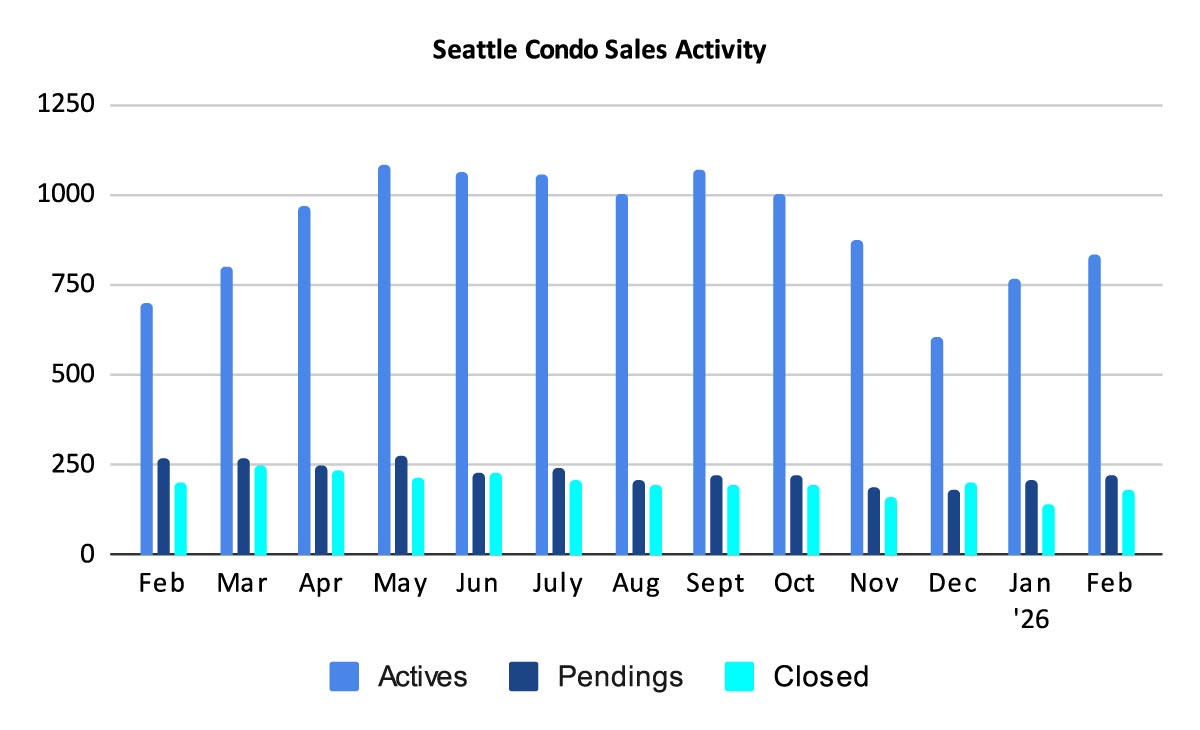
That said, the number of condo listings increased last month, but at a decreasing pace. Seattle ended February with 836 active listings for sale. That’s 19.6% more than last February and 9.3% more than the prior month.
We started the month with 765 listings and sellers added another 382 new listings for a total of 1,147 units. But, the 382 new listings in February reflected 14.5% fewer new listings compared to January and only 0.5% more YOY. While we have more listings for sale overall, sellers brought fewer listings to market. The increase in net listings for the month was mostly due to sluggish sales.
Of the 1,147 listings available for sale throughout the month, 311 came off the market for various reasons — pended and under contract, had quick closings, been expired or cancelled, rented out or for other reasons — leaving 836 remaining at month’s end.
As of the date of this post, Seattle’s active condo inventory is comprised of 77% traditional condos and 23% non-traditional condos.
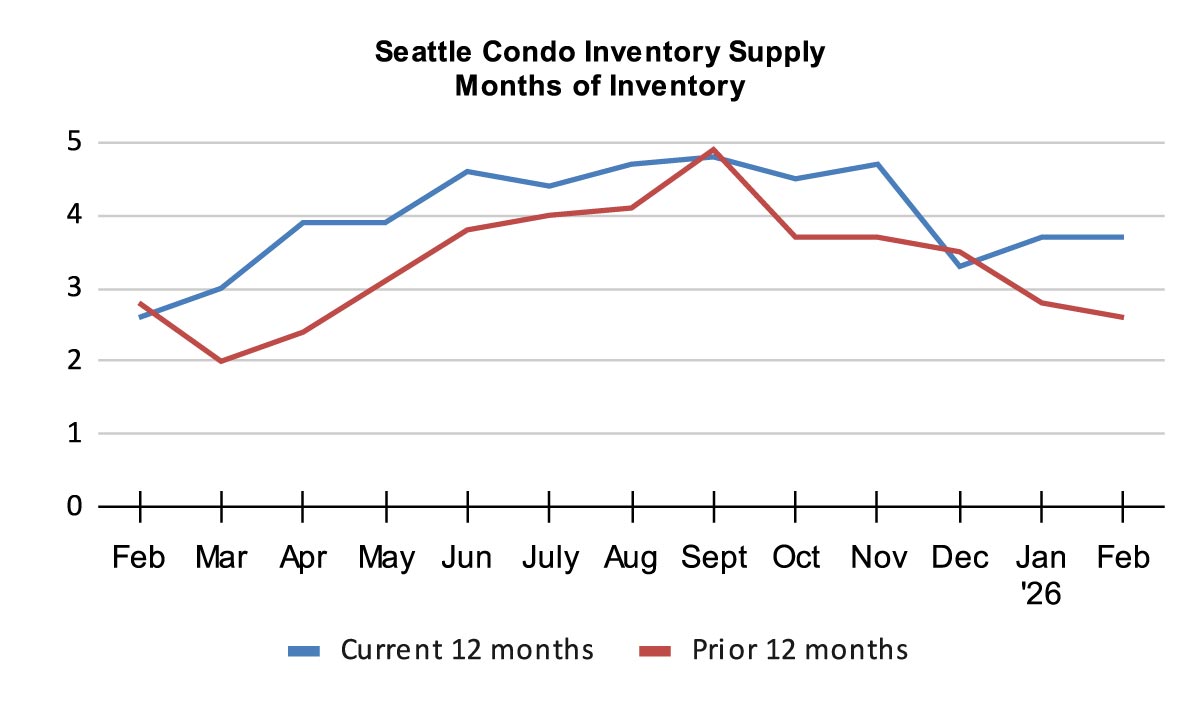
The Seattle condo inventory supply rate held steady at 3.7-months of supply, which kept Seattle on the cusp between a seller’s market and a normal market. This is an improvement over last February when the market had slid into a tighter seller’s market.
The inventory supply rate is a metric categorizing the current market condition. A rate of less than 4-month of supply is considered a seller’s market. A rate between 4 to 7-months is a normal or balanced market. And, a rate more than 7-months would be a buyer’s market. We use pending transactions when calculating the supply rate, though closed sales is also used.
Seattle is comprised of neighborhood and price point micro-markets. Neighborhoods with a dense concentration of condos like downtown, Queen Anne and Capitol Hill, are reflective of a balanced market with more than 4-months of supply. In areas with fewer condos such as North Seattle and West Seattle, they’re reflective of a seller’s market with under 3-months of supply.
Condo Sales Improve, Sluggishly
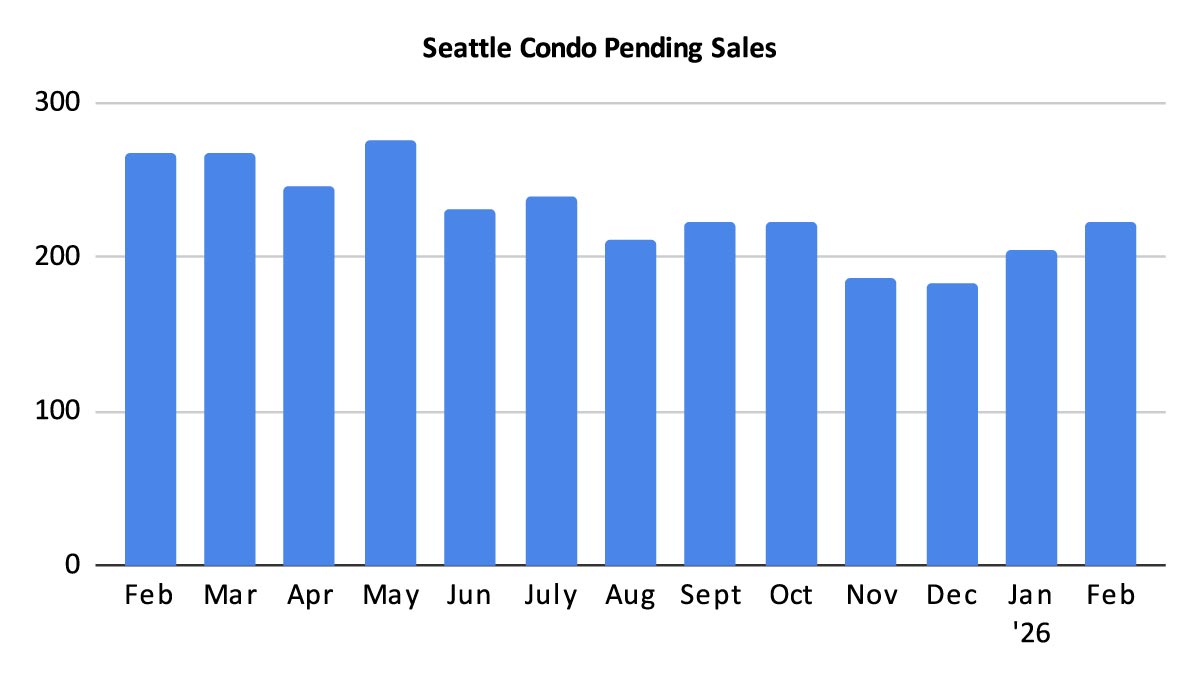
One of the reasons we have more listings and a decent inventory supply rate was due to softer condo sales in February. There were 223 pending transactions (listings under contract in escrow). That was an improvement over January by 8.8%, but sales velocity underperformed the same period last year by 16.5%. Sales are trending upwards, just not at the rate we experienced a year ago.
Buyers are buying, though many still remain on the fence. Lower mortgage interest rates, more choices, better values and contract terms have spurred some buyers. However, anecdotally we’re hearing buyers with concerns about tech sector layoffs, financial markets & investment balances, and global events, keeping them on the sidelines for now.
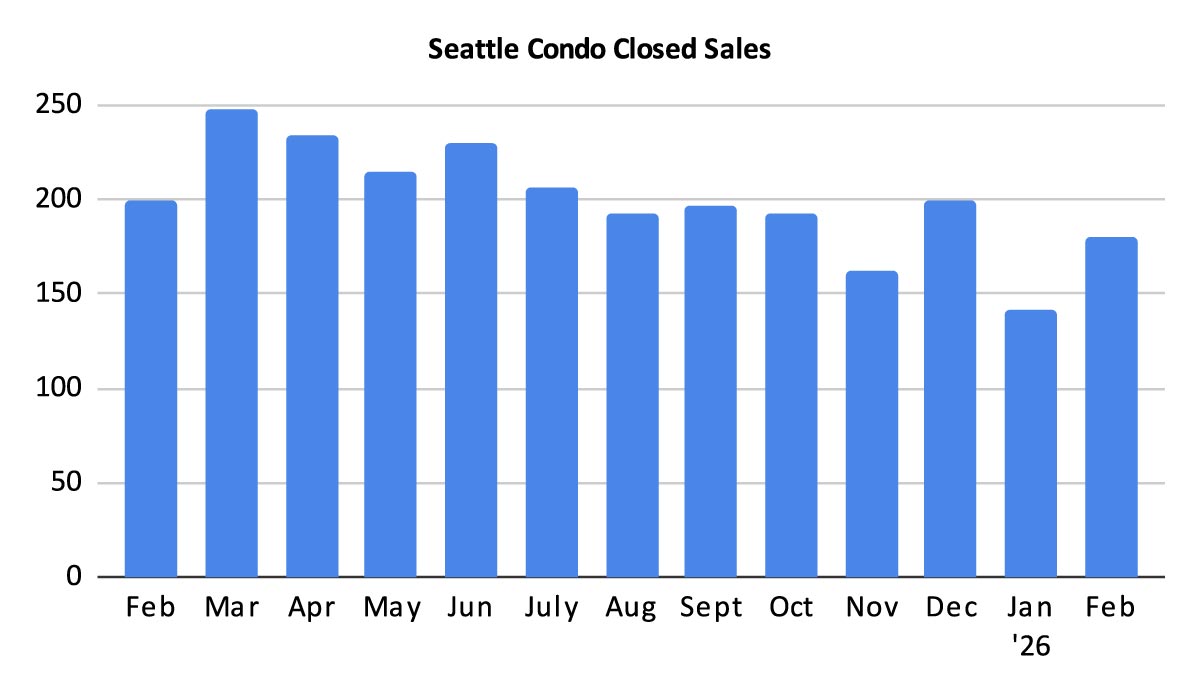
There were 180 closed condo sales in February, reflecting a one-year decline of 9.6%. It also exhibited a one-month jump of 26.8%, which were likely closing lags from December’s pending transactions. Usually, closings lag behind pendings by a month, though it looks like number of December sales had extended closings into February.
In Summary…
February exhibited a fairly typical month for Seattle’s condo market as we progress through the new year. Sales activity and selling prices rose, though at a lower rate than we experienced in February 2025.
Interestingly, even though the number of condo listings available increased, fewer sellers brought new listings to market in February. That should change, I expect we’ll see more listings as we move on towards spring.
For Seattle condo sellers, spring is the prime season for Seattle’s real estate market. Historically, it’s the most active period with the highest number of condo sales and selling prices. There are more buyers in the market place, but also more competition from other sellers.
For condo buyers, they’ll usually encounter higher selling prices and competition from other buyers in certain neighborhoods. However, the market is sluggish overall and has been underperforming so they may have the upper hand, especially in condo dense neighborhoods around the downtown core.
Seattle Condo Market Statistics February 2026
Source: Northwest Multiple Listing Service. Some figures were independently compiled by Seattle Condos And Lofts and were not published by the NWMLS.
© SeattleCondosAndLofts.com