October 2025 Seattle Condo Market Recap

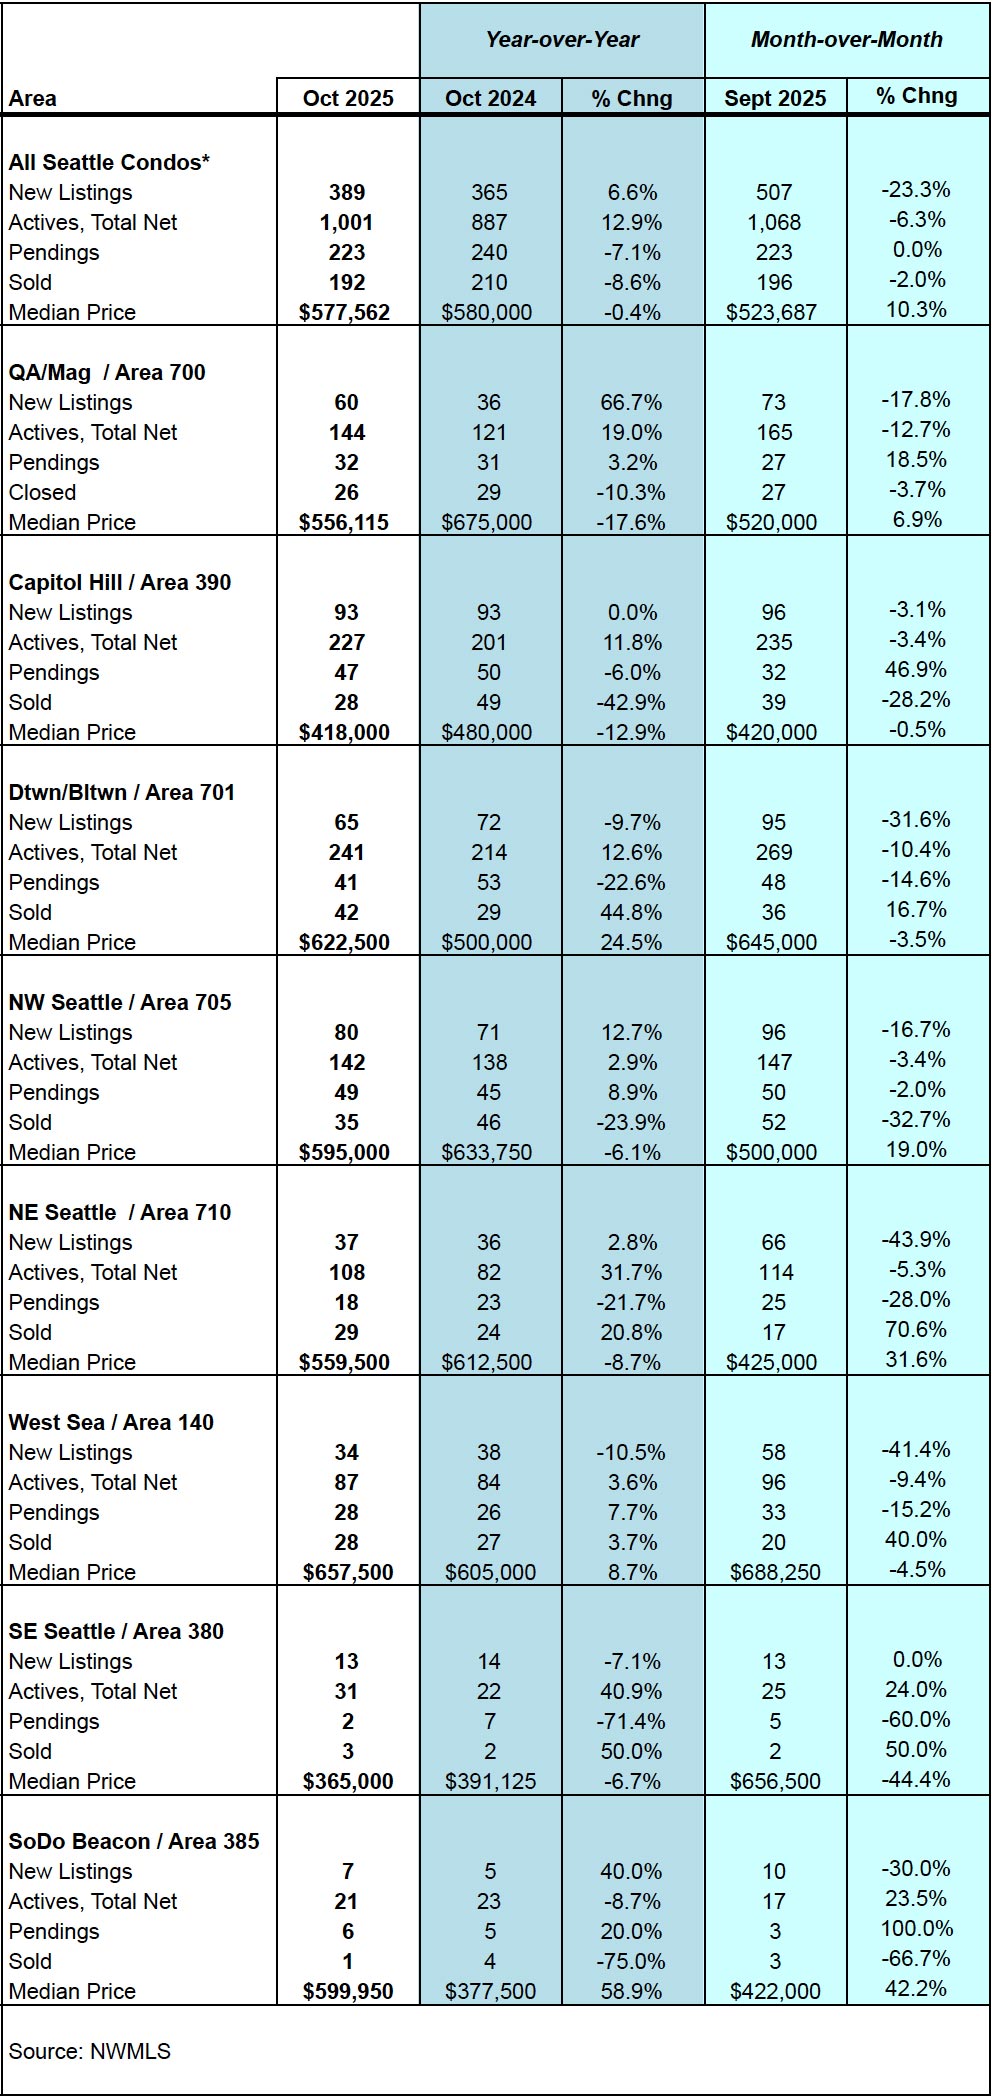
The October Seattle Condo market figures are in and it’s pretty much what we’d expect with the start of the Fall season. Seattle’s cyclical real estate market held true to form with the number of listings, unit sales and values trending down for the month.
Selling Prices Tempered Slightly
The Seattle citywide condo median sales price was $577,562. That represented a slight 0.4% year-over-year (YOY) dip compared to last October, but it also reflected a 10.3% bump over the prior month.
Most areas of the city reflected YOY median sale price decreases for the month with Queen Anne / Magnolia (-17.6%), Capitol Hill / Central Seattle (-12.9%), Northeast Seattle (-8.7%) and Northwest Seattle (-6.1%) experiencing the most fluctuation.
On the other hand, Downtown (24.5%) and West Seattle (8.7%) exhibited a YOY increase in their median selling prices. View full neighborhood area statistics at this table at the end of the post.


These figures were compiled by the NWMLS, which has a broad definition of “condominium”. The NWMLS lumps in various types of properties that we don’t typically associate as a condominium.
These non-traditional condos include townhomes, condoized single family houses, accessory dwelling units (ADU), detached accessory dwelling units (DADU), boat moorage and floating homes. For the most part these are newer, larger and higher valued than the traditional condo unit, thus impacting condo statistics.
Excluding non-traditional condos, then the Seattle citywide median sales price for regular condos was $530,000 in October. Rather than exhibiting a decrease as noted with the NWMLS broad classification, traditional condos experienced increases in their median selling prices. The segment increased 2.9% YOY and 18.6% over the previous month.
As for non-traditional condos, they represented 19.6% of the condo sales in October with a median sales price of $775,000. That reflected a YOY decrease of 3.2% and a one-month improvement of 3.7%.
Non-traditional condos usually raise the median sales price mid-point, but this past month, they depressed it while traditional condo values increased.
Listings Fall with the Season
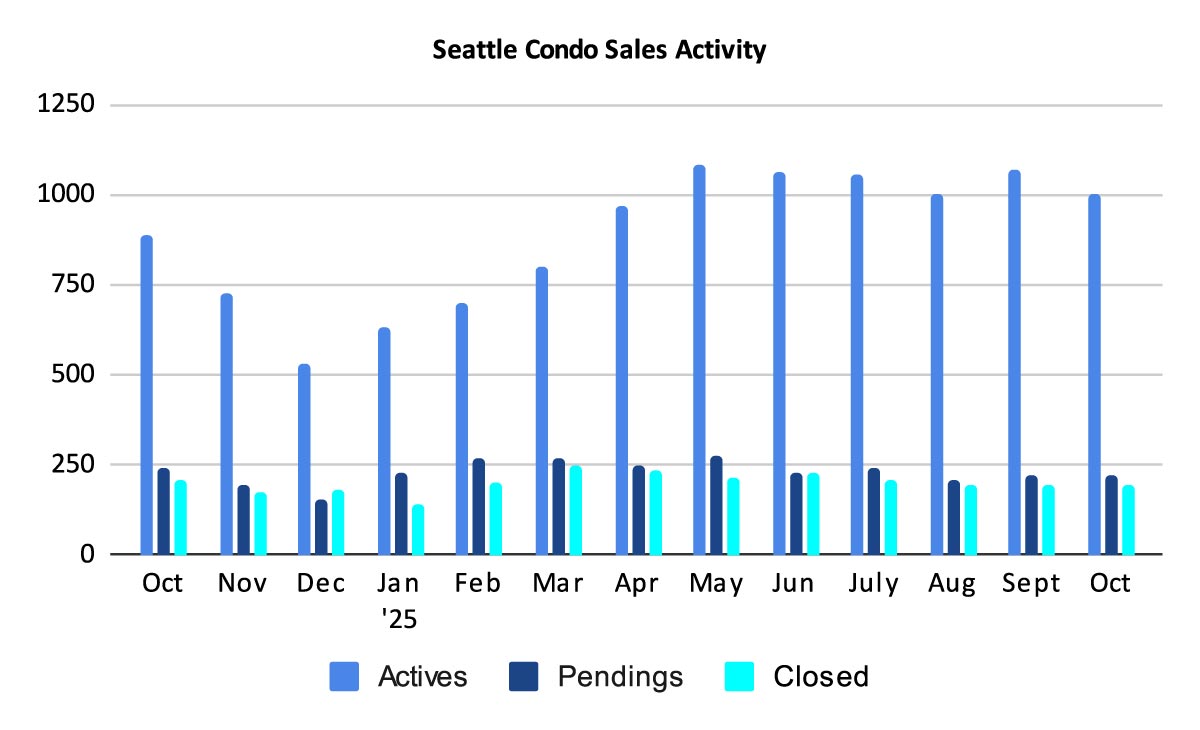
As we’d expect with the start of the Fall season, the number of condo listings reduced and will do so throughout the remainder of the year. We ended October with 1,001 condos listed for sale in the NWMLS. That was still 12.9% over the number we had for sale during the same period last year, but it was also 6.3% fewer than we had a month ago.
We started October with 1,068 properties for sale and throughout the month sellers added another 389 new listings for a total of 1,457 listings. Of that total, 456 units came off the market through various means – pending sales, cancelled or expired listings, were rented out or other reasons.
The inventory supply rate dipped to 4.5-months of supply. The supply rate is a classification metric for the real estate marketplace.
A rate of less than 4-months of supply is considered a seller’s market, while a rate from 4 to 7-months of supply is a balanced or normal real estate market. And, a rate greater than 7-months of supply would be a buyer’s market.
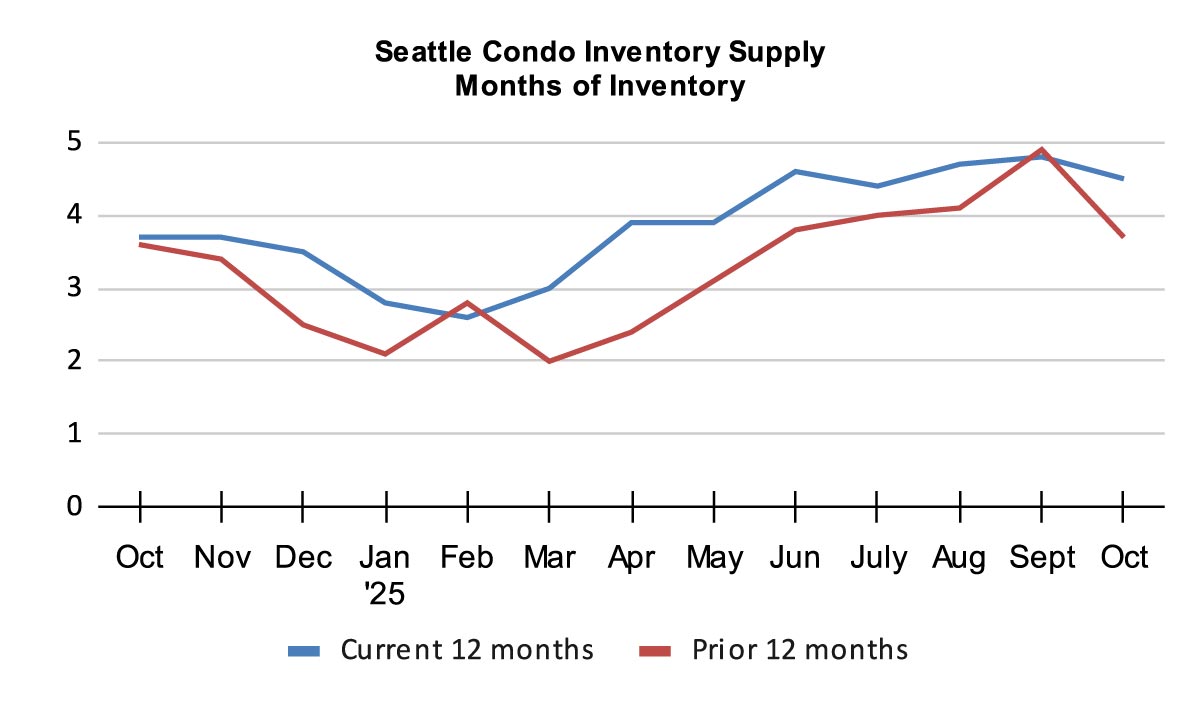
Based on the inventory supply rate of 4.5-months, Seattle’s condo market reflected a balanced / normal market conditions overall last month. However, Seattle’s real estate market is comprised of various micro-markets based on location and price points so buyers and sellers may encounter differing experiences.
For example, Northwest Seattle and West Seattle have supply rates around 3-months, placing those areas in a seller’s market. Downtown and Northeast Seattle are close to 6-months of supply, and Southeast Seattle is at 15.5-months of supply. Southeast Seattle’s inventory is predominately townhomes, boat moorage and pre-sale units in new cooperative under construction. If we look at just traditional condo units, then the rate would be significantly lower.
Single family dwellings, by comparison, had a 2.3-month supply rate in October…making for a competitive marketplace.
Sales Dampen
There were 223 pending condo transactions (listings under contract in escrow) in October, the same number as the previous month. Though, compared to the same period last year, pending sales were down 7.1%.
Uncertainty with the economy, Seattle’s tech sector job market, and our cyclical/seasonal change may have have tempered buyers. That said, historically, the sales velocity will decrease as we round out the remainder of the year.

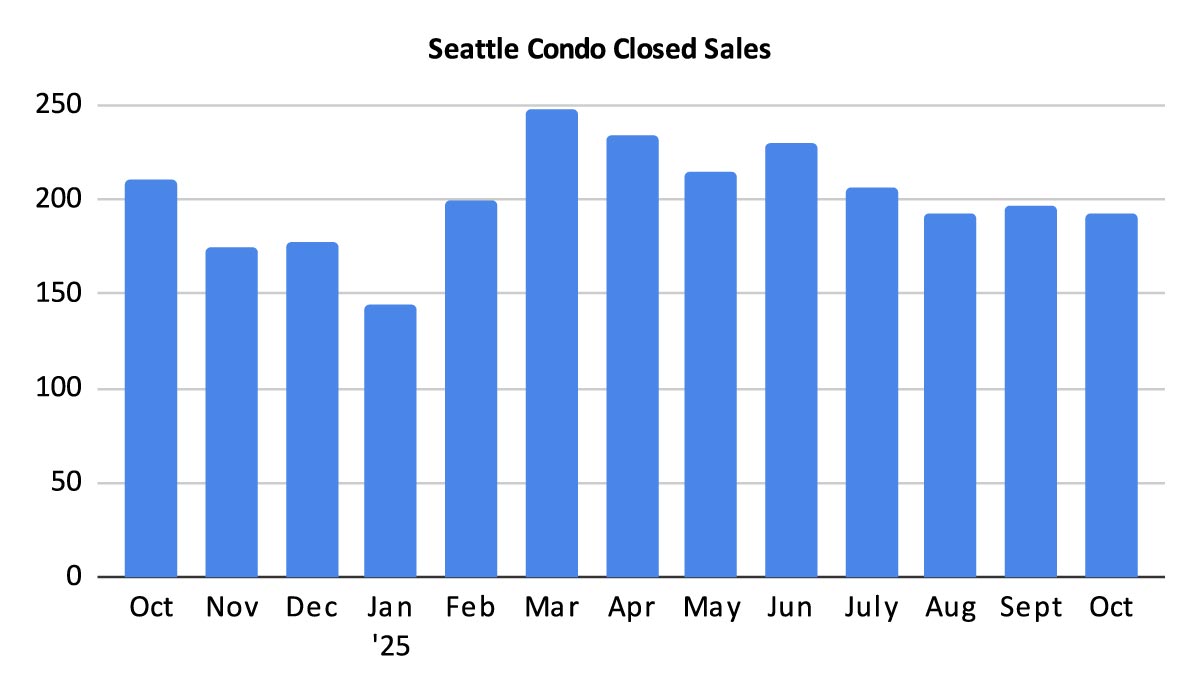
As with pendings, the number of closed condo sales also diminished in October. The 192 closings represented an 8.6% YOY and 2% one-month decrease, respectively.
In Summary
The October numbers reiterated Seattle’s cyclical, seasonal real estate marketplace. The number of listings and condo sales reduced and will continue to do so through the rest of the year.
Seattle’s citywide median sales priced dipped slightly overall due to the non-traditional condo segment. However, traditional condos exhibited an increase in its median sales price for the month.
As a whole, Seattle remains in balanced market environment, though buyers and sellers may experience differing outcomes based on neighborhood location and price point.
Seattle Condo Market Statistics October 2025
Source: Northwest Multiple Listing Service. Some figures were independently compiled by Seattle Condos And Lofts and were not published by the NWMLS.
© SeattleCondosAndLofts.com