Seattle Condo Market Update July 2022
At mid-year the Seattle Condo market performed as we’d expect in the summer transition between the active spring market and the cooling fall seasonal market. Median selling prices remained steady along with rising inventory and slowing condo sales activity.
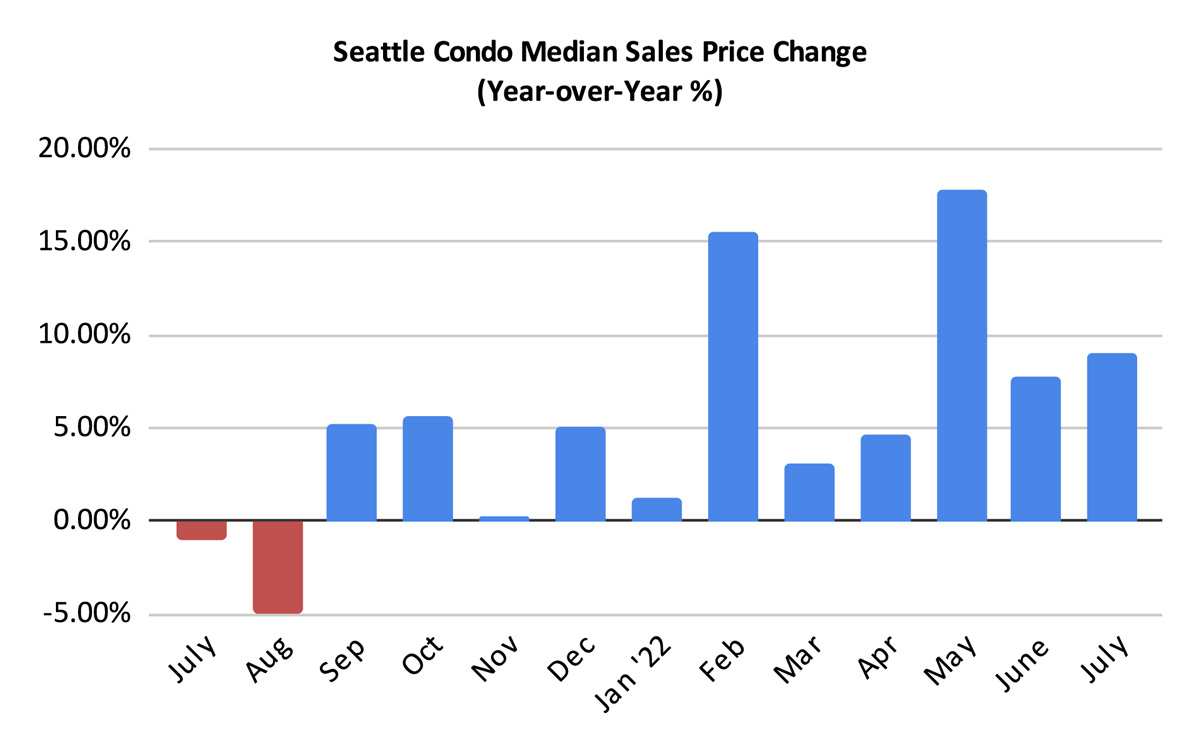
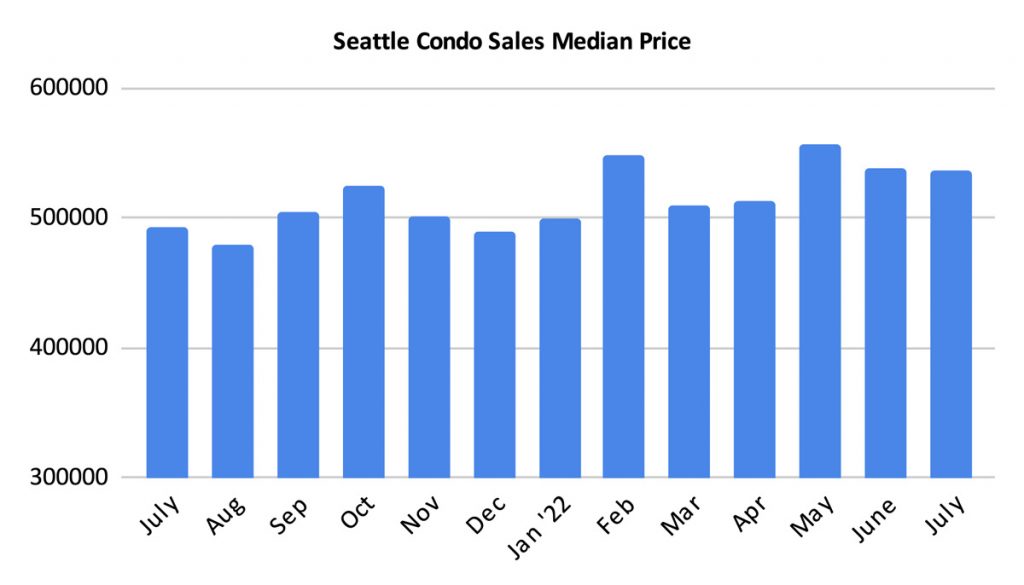
The citywide condo median sales price for Seattle rose 9% year-over-year (YOY) and roughly par with June at $537,000. That’s the 5th highest amount it has been on record, and the 4th so far this year. Year-to-date, the Seattle condo market has experienced some of the highest selling prices in its history. Although, the second half of the year will be more tepid.
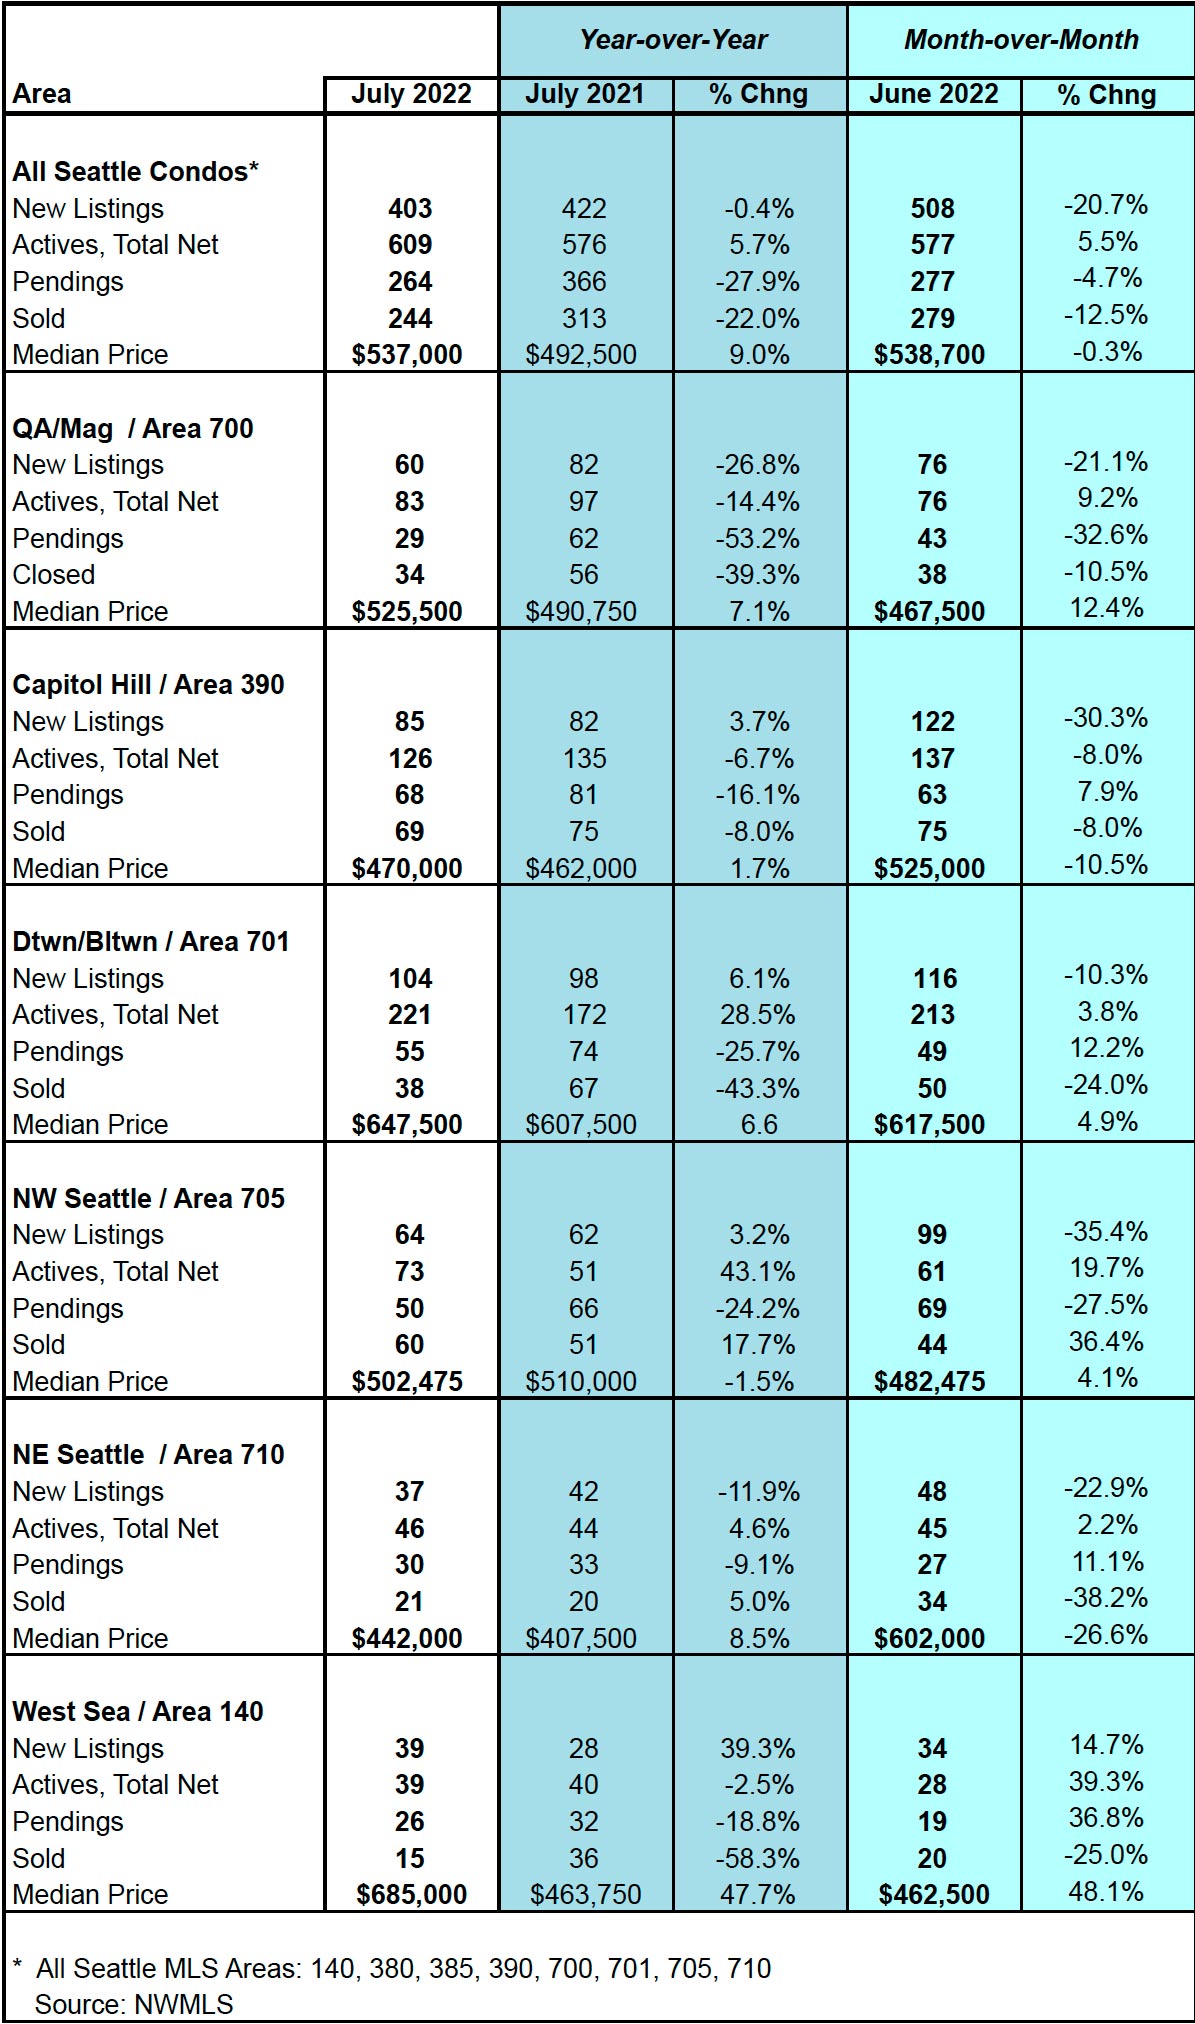
All neighborhood areas also reflected positive YOY results in their median sales prices with the exception of Northwest Seattle, which dipped just slightly by 1.3%. You can view the full neighborhood results in this table.
West Seattle was a bit of an anomaly increasing 47.7% over last July. While that may contemplate pricing improvement, the underlying reason for the spike was a shift of the mid-point. The median is the selling price of the property at the mid-point where half of the units sold were above that price and half were below. Last year, there were 36 condo sales with a wide-range in prices. This year, there were only 15 sales at the higher end of the price spectrum, thus shifting the median mid-point.
If we look at the average selling price for West Seattle, July 2022 would have reflected an 8.1% increase over July 2021.
Inventory Increased But At A Slower Pace
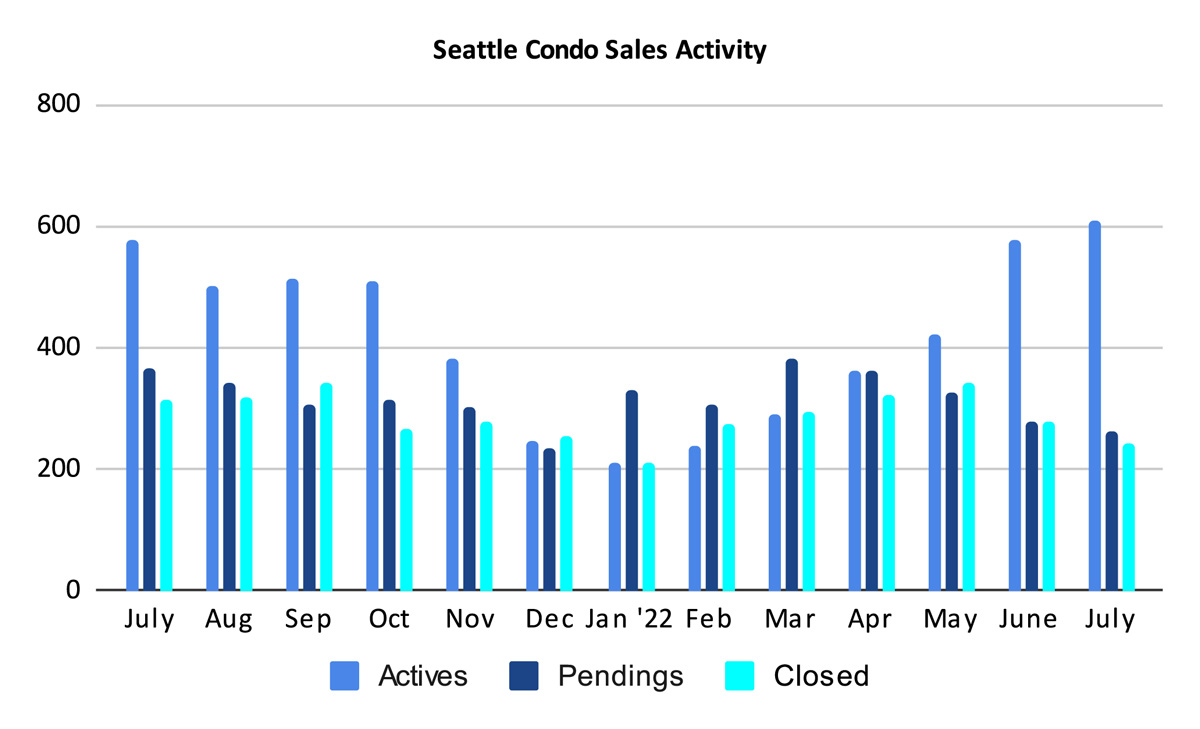
The number of NWMLS active Seattle condo listings for sale increased to 609 units in July, reflecting a 5.7% one-year and 5.5% one-month increase.
This number is used by the NWMLS to signify the number of listings for the month, though it is actually the net number of listings on the last day of the month.
To that end, sellers added 403 new condo listings in July compared to 422 new listings a year ago and 508 last month.
To clarify further, we started July (or ended June) with 577 units, added 403 new listings and ended July with 609 units for sale. Therefore, 371 condo units came off market during the month – a mix of sales, cancellations, expired listings, failed sales and units being rented.
At least for July, while the overall number of listings increased, the number of newly listed properties reduced. That is, fewer sellers listed properties for sale, which is inline with our cyclical market trend.
The caveat. These figures are from the NWMLS database which only include condo units that have been listed for sale in the MLS. It does not include the several hundred units available for purchase at recently completed condo buildings in the downtown area since those are not reflected in the MLS.
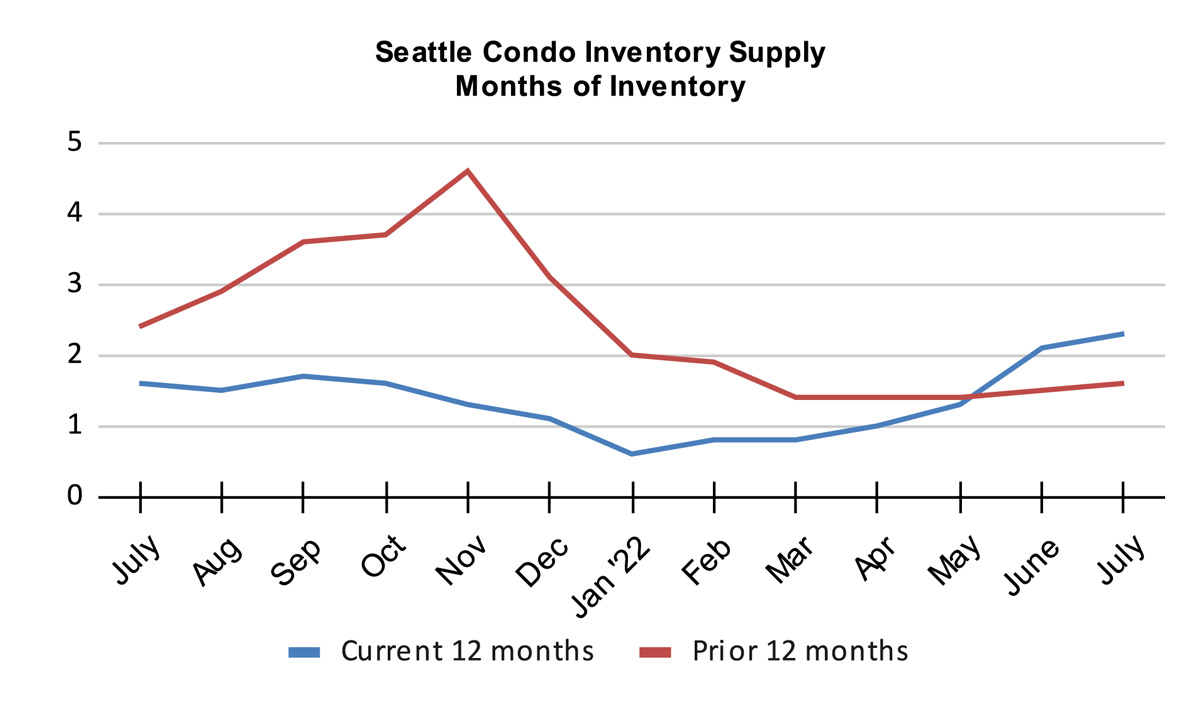
The increase in the overall number of listings, combined with slowing sales activity, resulted in an uptick to the inventory supply rate to 2.3-months of supply in July. In effect, at the current rate of sales it will take 2.3-months to exhaust the existing inventory.
This is a market environment metric. A rate of under 4-months of supply is characterized as a seller’s market, between 4-6 months a normal market, and above 6-months would be a buyer’s market.
For now, Seattle is still entrenched in a seller’s market, which we’ve been in for a decade. Though, market conditions vary by neighborhood. For instance, the condo dense downtown area is more reflective of a normal market compared to the rest of the city, which are exhibiting a tighter market environment. However, with rising inventory, a cooling market place, and our seasonal fall slow down, the supply rate will increase. It is quite possible we’ll have a balanced market by the end of the year.
Another way to view supply is the absorption rate. Seattle’s condo absorption rate in July was 43.3%, that is, buyer’s consumed 43.3% of the inventory. And, as a metric, a rate over 20% is characterized as a seller’s market.
Condo Sales Stagnate
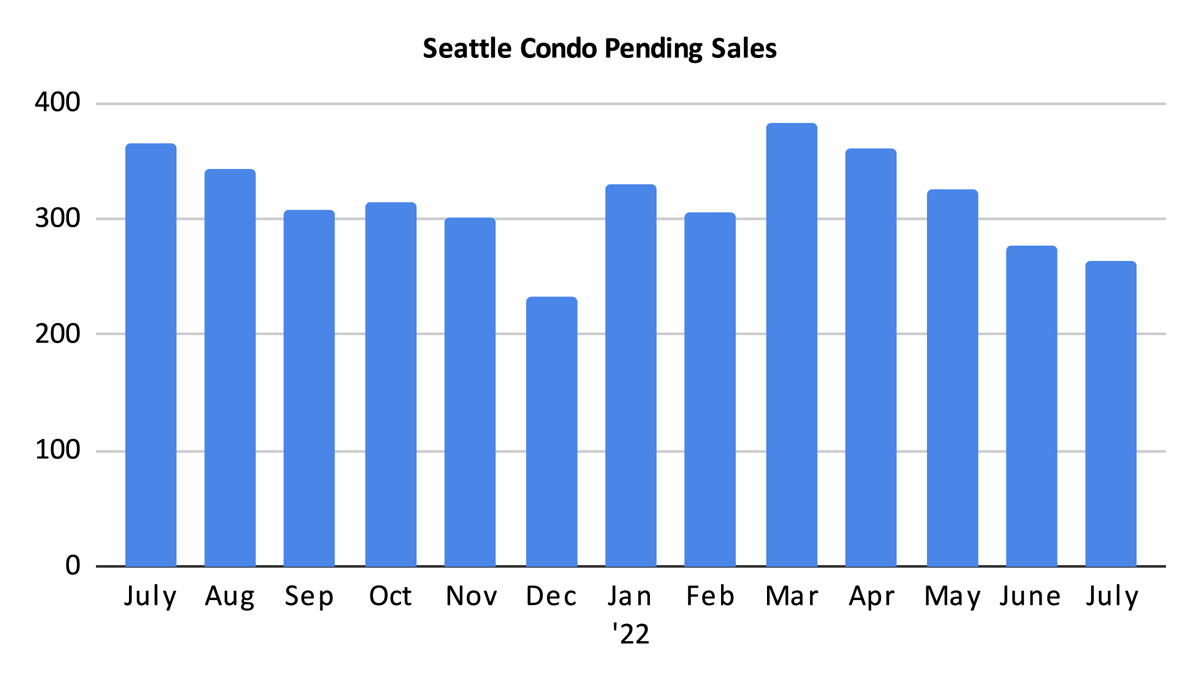
There were 264 pending sales transactions (listings under contract in escrow) last month, reflecting a sizable one-year drop of 27.9%, and 4.7% fewer than in June.
Cyclically for our market, pending sales trend downwards from summer and onward. Though, it seems to be doing so earlier and at an accelerated pace this year.
Mortgage interest rates, inflation and buyer concerns with a fluctuating market place are factors that have sidelined some buyers for the time being. On the other hand, price adjustments are becoming common with both resale and new construction condos. Lower prices and more favorable terms may entice buyers off of the fence.
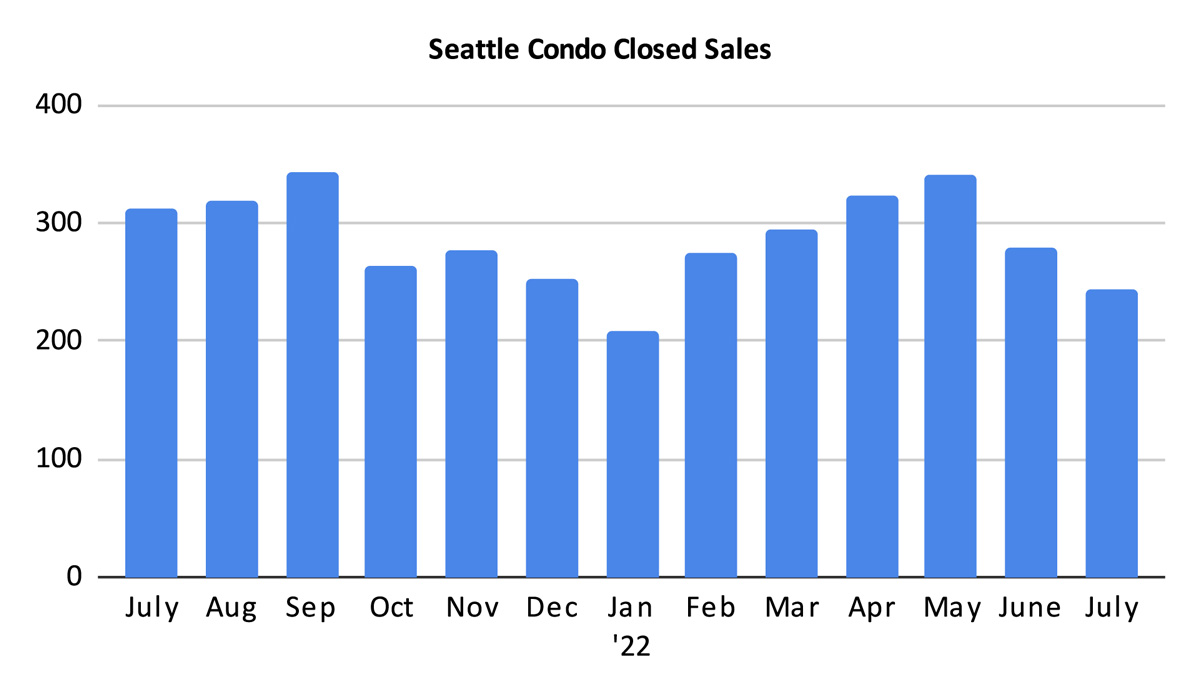
As expected, the number of closed Seattle condo sales decreased in July to 244 units. That’s 22% and 12.5% fewer than last July and from June, respectively.
Closings trail pendings by a month, so with pendings reducing we’d see fewer closings as a result.
Outlook
One thing that you can rely upon is that Seattle’s condo and real estate market is remarkably consistent. We follow a cyclical market driven by the seasons. Mid-year is typically reflective of a plateauing to cooling conditions and July results exhibited that.
Selling prices outperformed 2021 levels but they are softening. That’s partly due to external factors (ie interest rates, inflation, etc) and buyer trepidation, and partly due to our seasonal market trends. Sales slowed considerably and far fewer than we had last year.
Going forward, the market will soften through the second half of the year. We’ll start see supply reduce and condo sales stagnate further. If the cycle holds, though, we may see a slight bump in activity in September/October. This is a short buying phase between the end of summer and the start of the fall holiday season.
Seattle Condo Market Statistics July 2022
Source: Northwest Multiple Listing Service. Some figures were independently compiled by Seattle Condos And Lofts and were not published by the NWMLS.
© SeattleCondosAndLofts.com