June 2012 Seattle Condo Market Update
The June 2012 results reflected continued recovery of Seattle’s condo market – Median prices improved while sales remained stable.
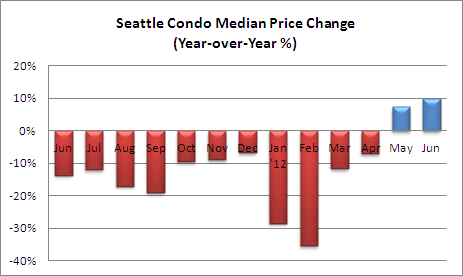
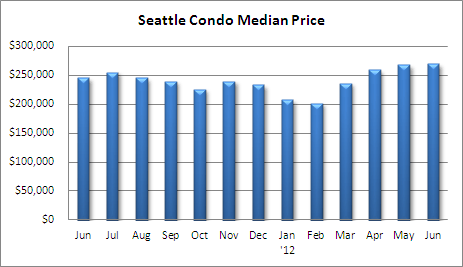
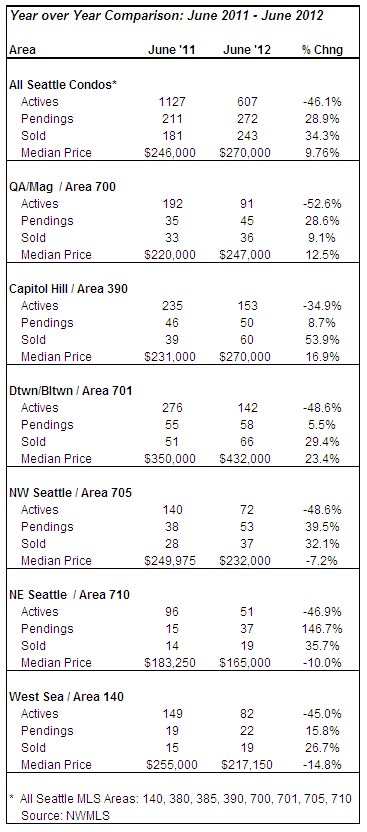
June marked the second consecutive monthly year-over-year improvement of the citywide median condo sales price, rising 9.76% to $270,000, and roughly on par with May (+0.05%). Downtown, Capitol Hill and Queen Anne all reflected double digit increases in median sale prices of 23.4%, 16.9% and 12.5%, respectively, while North and West Seattle neighborhoods reflected declines in median prices.
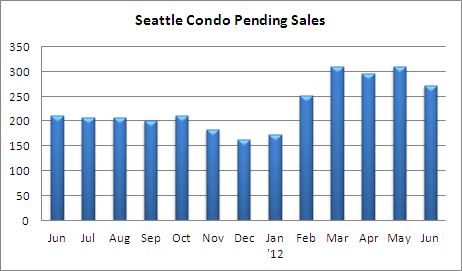
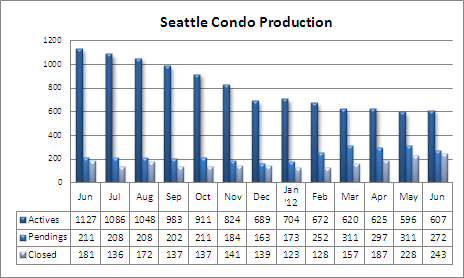
The number of pending transactions, properties under contract but not yet closed, continued to outperform 2011 with a 28.9% jump in pendings to 272 units. Pending units did falter by 12.5% compared to May, though seasonally, sales taper during the summer months so this was not unexpected.
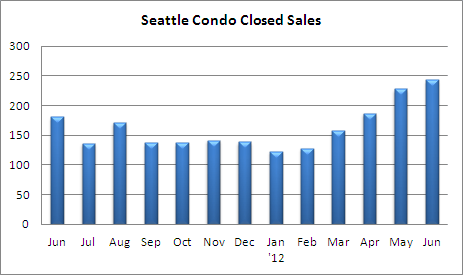
The number of closed condo sales in Seattle rose 34.3% over last June and 6.6% over May to 243 units, the most since June 2008. As closed sales lag behind pendings, this figure will fluctuate based on the pending volume of the prior month and it will likely decrease next month.
The available Seattle condo units for sale remained relatively flat with 607 units listed last month, a drop of 46.1% compared to last June. The remaining new construction condos continued to reduce with at least four developments in the Seattle region likely to sell out by the end of summer.
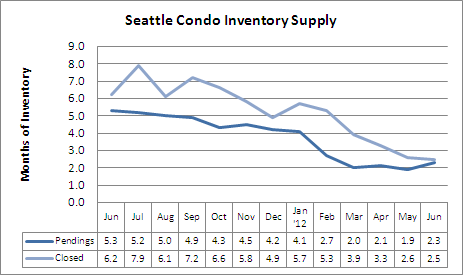
Seattle’s condo inventory supply rate inched up slightly in June to 2.3-months of supply as a result of fewer pending transactions, which still keeps the region in a seller’s market (low inventory, high demand and rising prices).
Progressing through Summer, the trend we’ve experienced should continue with stable sales volume, low inventory and improving median sale prices throughout Seattle and the region.
Source: NWMLS. Some figures were independently compiled by SeattleCondosAndLofts.com and were not published by the Northwest Multiple Listing Service.
________________________
© SeattleCondosAndLofts.com





Ben – is there more granular data you can provide? I can’t really understand why the MLS and real estate industry continues to rely on median pricing which is a poor measure of things. Do you have averages and ranges? or even specific sales? When you look at belltown/downtown data and it says prices went up 23%…well, lets dig deeper. what does that really mean? does that mean that there were more sales at Escala and olive 8 and those drove the prices up? I live in belltown and the prices here definitely are NOT going up 23%. no way, no how. I think that some sellers read these numbers and then have been raising their prices b/c they think that’s reality and there’s low inventory. this seems like a very very temporary blip. in a month or two we’ll look back and see a 2-3 month rise in the summer (as usual) and then it will go back down.
also, why compare month over month (June 2012 vs. June 2011) instead of YTD average or quarterly averages? these would be much more stable and accurate data, wouldn’t they?
Jane – thanks for the comment. The monthly updates are really just a one-month snapshot of the market, and you’re correct, they can fluctuate widely and by themselves are not great indicators/metrics. The market is seasonal so we do expect ups and downs in sales activity and median sale prices.
There is only so much I can provide in a blog post so I tend to keep it more of a higher level overview. For my clients, though, I do provide far more detailed analysis and in-depth figures specific for their criteria. Though, it’s a great point and I’ll try to provide deeper analysis in the future.
I’ve stopped posting average sale prices as one or two sales could significantly skew the average in any given month.
I have done quarterly updates and I should have one coming up for the 2nd quarter.
thanks for the reply. Actually some basic sales distribution data would be helpful. I think even something like splitting the data up into quarters – e.g. 0-250k, 251-500k, 501-750k, 751-1million for example. that would show if the mean or average is actually increasing. or just a function of a few more expensive units selling.
my hunch is that its mostly about the distribution. if there are more sales of a newer more expensive building then it drives the “mean price” up and makes it appear that prices are rising.
so the question..is that really true? when you remove a few of those buildings, are the prices actually increasing?