Seattle Condo Market Recap July 2025

Overall, the Seattle condominium market had fair results in July. Condo unit sales and the number of active listings increased compared to last July. Although, prices tumbled a little.
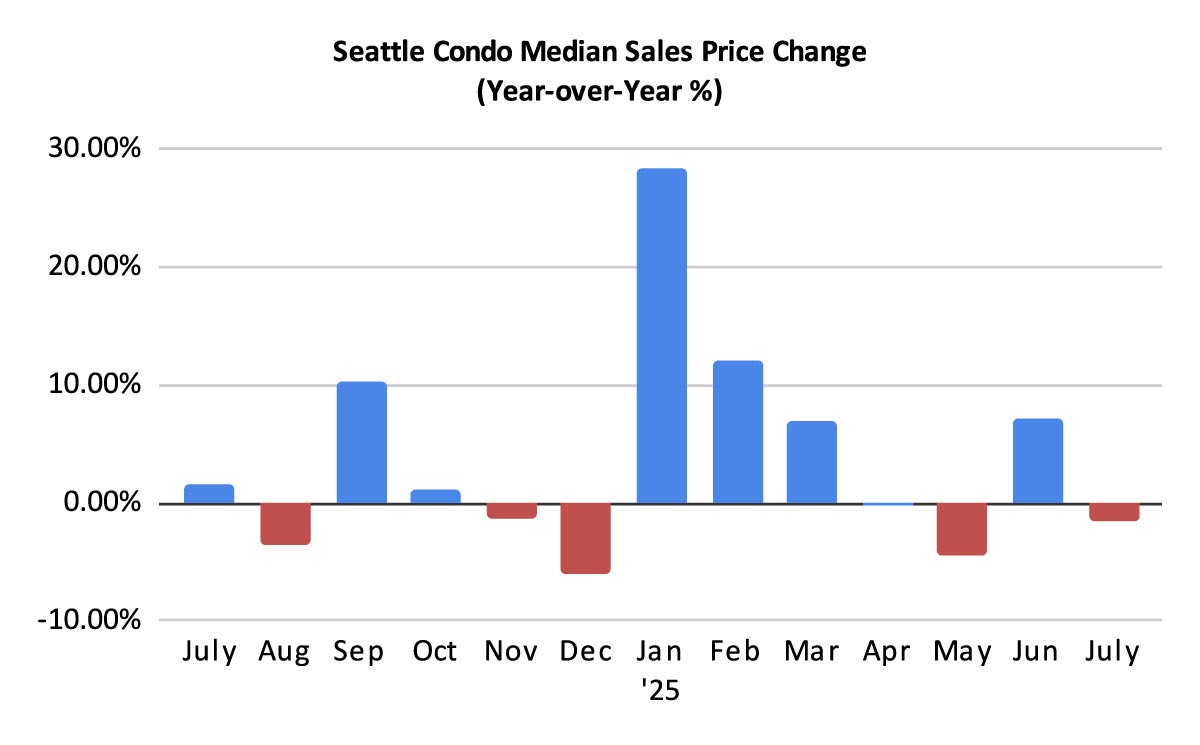
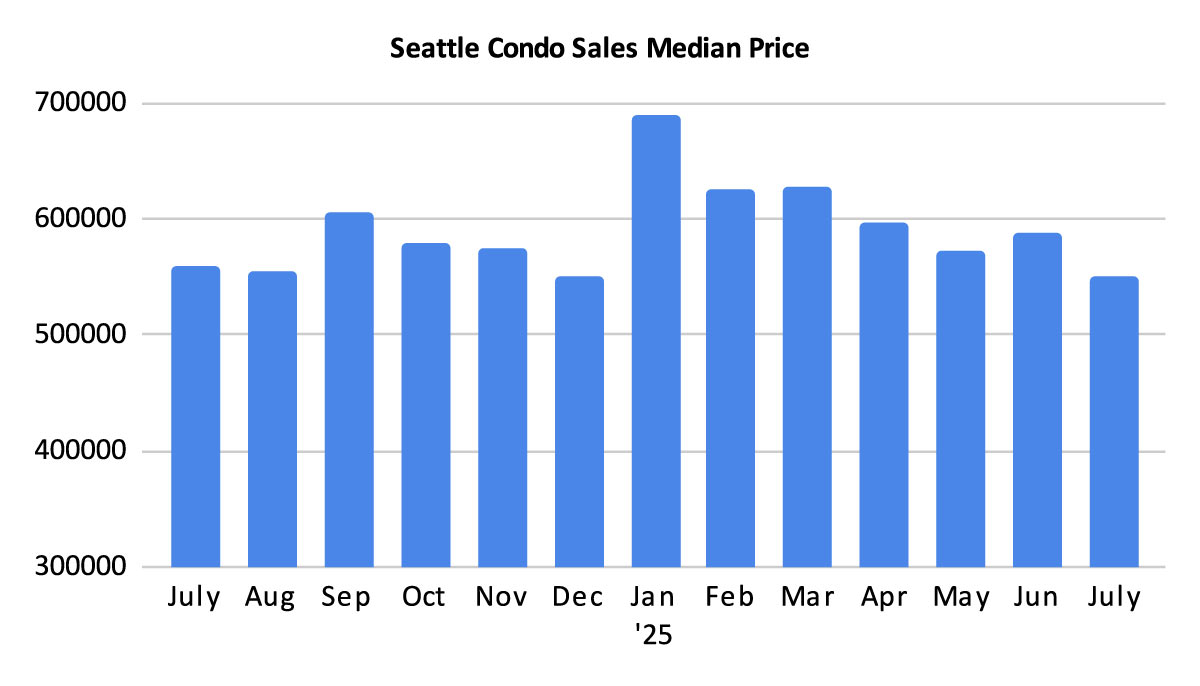
Prices Are Up … or Down Depending on Location
The Seattle citywide median sales price for condos was $550,000 last month. That reflected a year-over-year and a month-over-month drop of 1.6% and 6.6%, respectively.
While that may seem a bit glum, only three areas of the city realized decreases for the month. Breaking it down by NWMLS neighborhood areas – West Seattle (-25.8%), Queen Anne / Magnolia (-20%) and Northeast Seattle (-12.7%) exhibited decreases to their median selling prices.
On the other hand, selling prices increased throughout the rest of the city. Northwest Seattle (+23.8%), Capitol Hill / Central (+13.1%), Downtown / Belltown (+0.8%) and South Seattle reflected increases. See complete results at the end of the post here.
The change in median sales prices doesn’t necessarily correlate to appreciation or depreciation. The median sales price mid-point is also influenced by the type of property and price points.
The NWMLS classification of “condos” is quite broad. It includes the traditional single unit in a multi-unit building or complex. In addition to that, the NWMLS classifies townhomes, condo-ized single family dwellings, Accessory Dwelling Units (ADU) & Detached Accessory Dwelling Units (DADU) as condos. These are typically newer and more expensive, which raises the citywide median sales price. They also accounted for 23.7% of all condo sales in July. That’s nearly 1 in every 4 sales.
Excluding these non-traditional condo properties, the median sales price for typical, traditional condos was $425,000. That’s 5.6% less than last July and 16.9% less than the previous month.
Inventory Outpaces 2024, But Trending Down
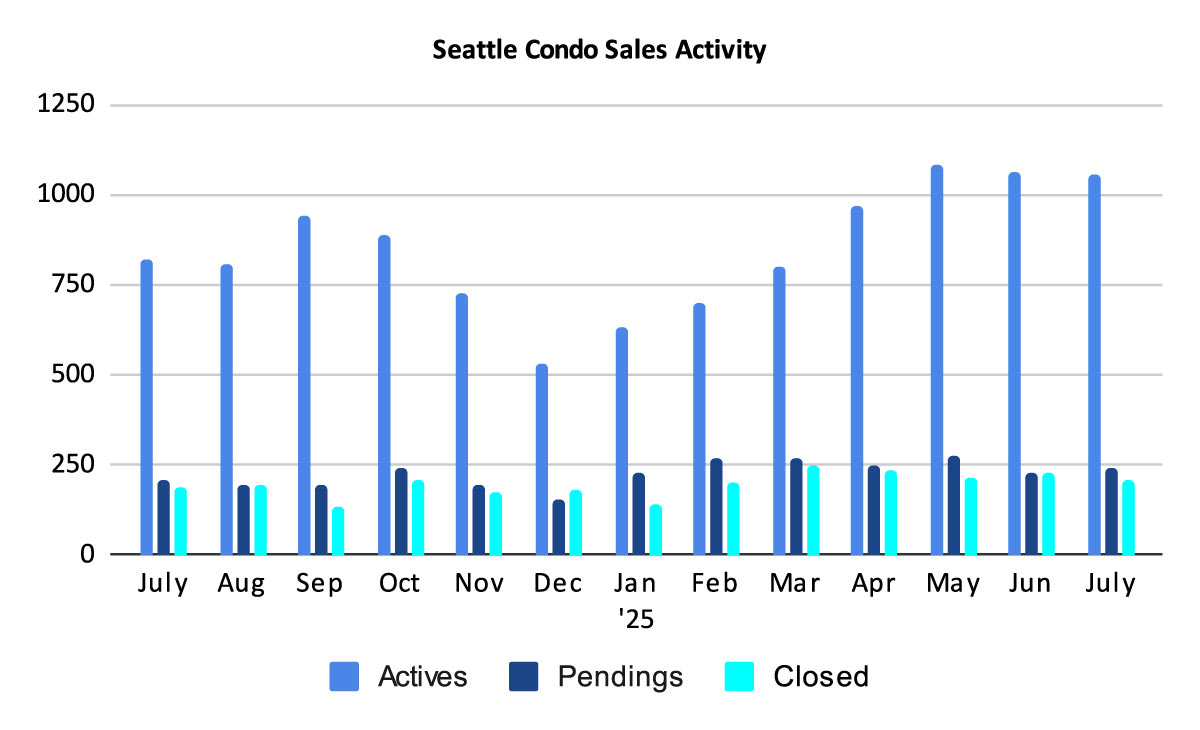
Seattle ended July with 1,059 active condo listings for sale. That’s 29.3% more than we had a year ago, but 0.8% fewer than the prior month.
We started the month with 1,064 listings and sellers added another 411 units throughout the month for a total of 1,475. Of that, 416 units came off the market for various reasons (e.g. pending/under contract, expired, cancelled or rented), leaving 1,059 at month end.
Currently, non-traditional condos make up 17.1% of the active condo inventory.
If Seattle sticks to its cyclical, seasonal market, then the number of active listings will trail off through the end of the year.
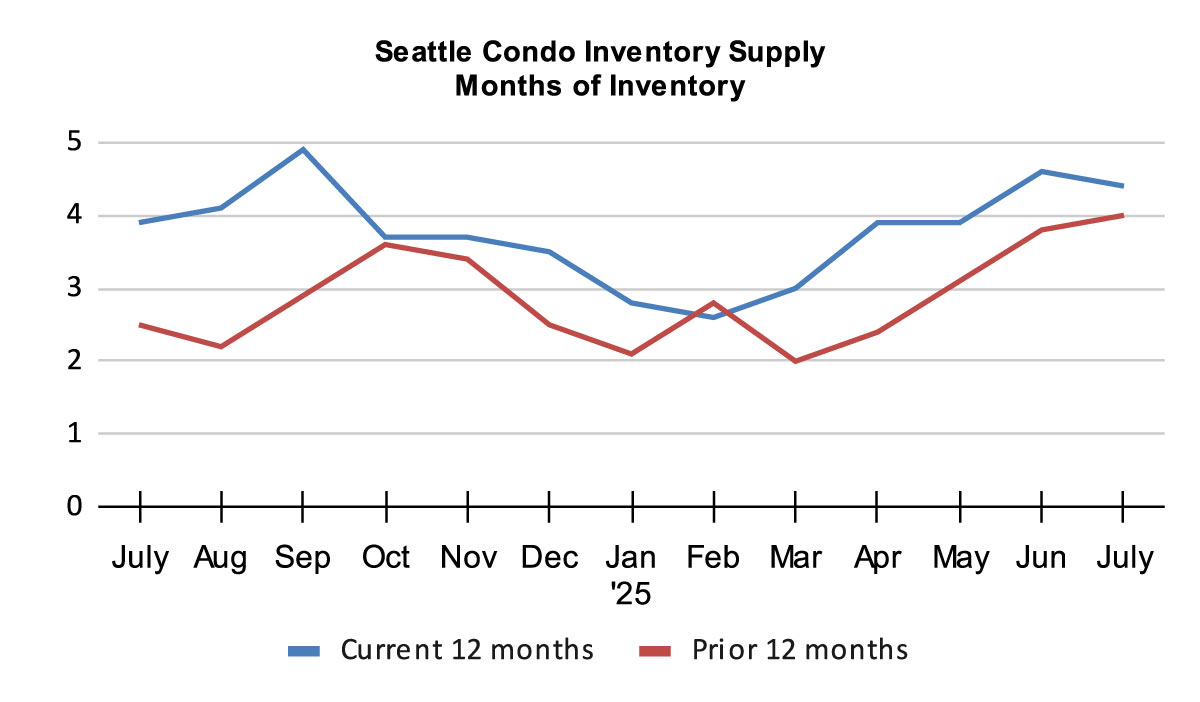
The inventory supply rate tempered slightly to 4.4-months of supply based on pending sales transactions. This indicates that if no additional new listings come to market, then it will take 4.4 months at the current rate of sales to exhaust the current inventory.
We use this metric to characterize the real estate market place environment. A rate of less than 4-months of supply is characterized as a seller’s market. A rate between 4 to 7-months is a balanced or normal market. And, a rate over 7-months is considered a buyer’s market.
This reflects Seattle as a whole. However, Seattle is comprised of micro-markets, thus buyers and sellers will encounter differing market conditions based on neighborhood locale and price point. For example, Northwest Seattle (e.g. Ballard area) had a supply rate of 2.3-months last month while Downtown was at 6-months.
Supply can also be expressed as the Absorption Rate. Seattle’s Absorption Rate was 22.7% in July, which placed the market on the cusp between a seller’s market and a balanced market.
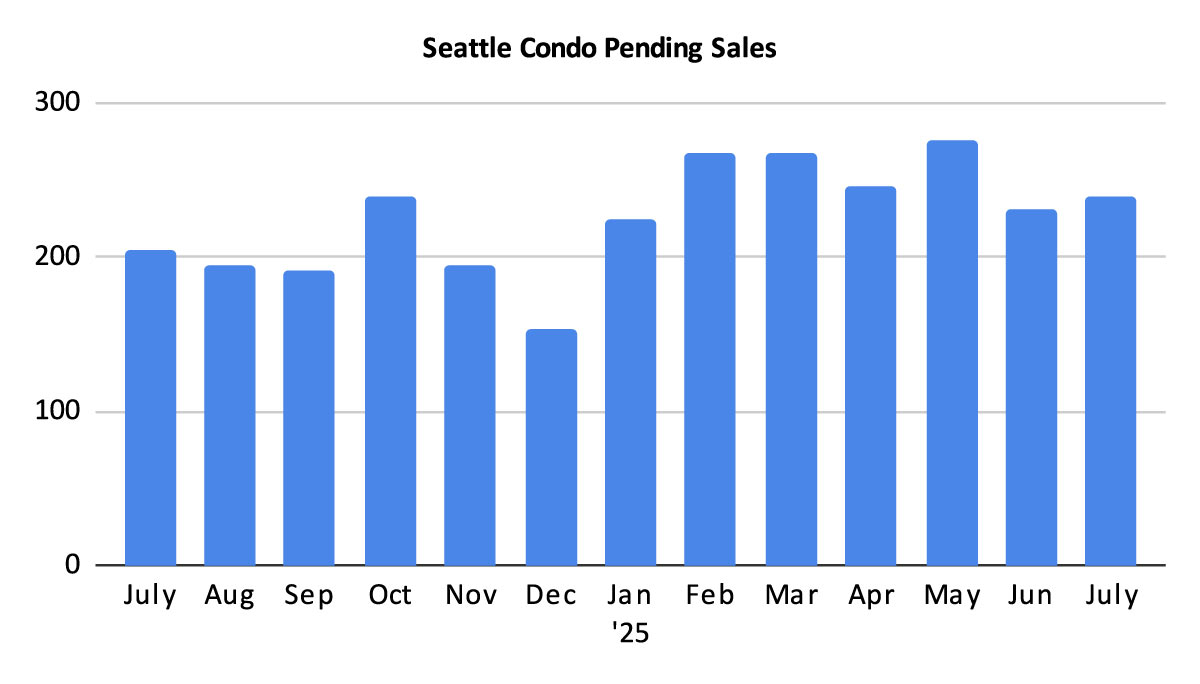
Condo Sales Improve
Condo sales was the bright spot last month with 240 units going under contract into pending status. That reflected a year-over-year jump of 17.1% and a one-month increase of 3.9%. As a whole, 2025 condo sales have been outpacing 2024 levels so far this year.
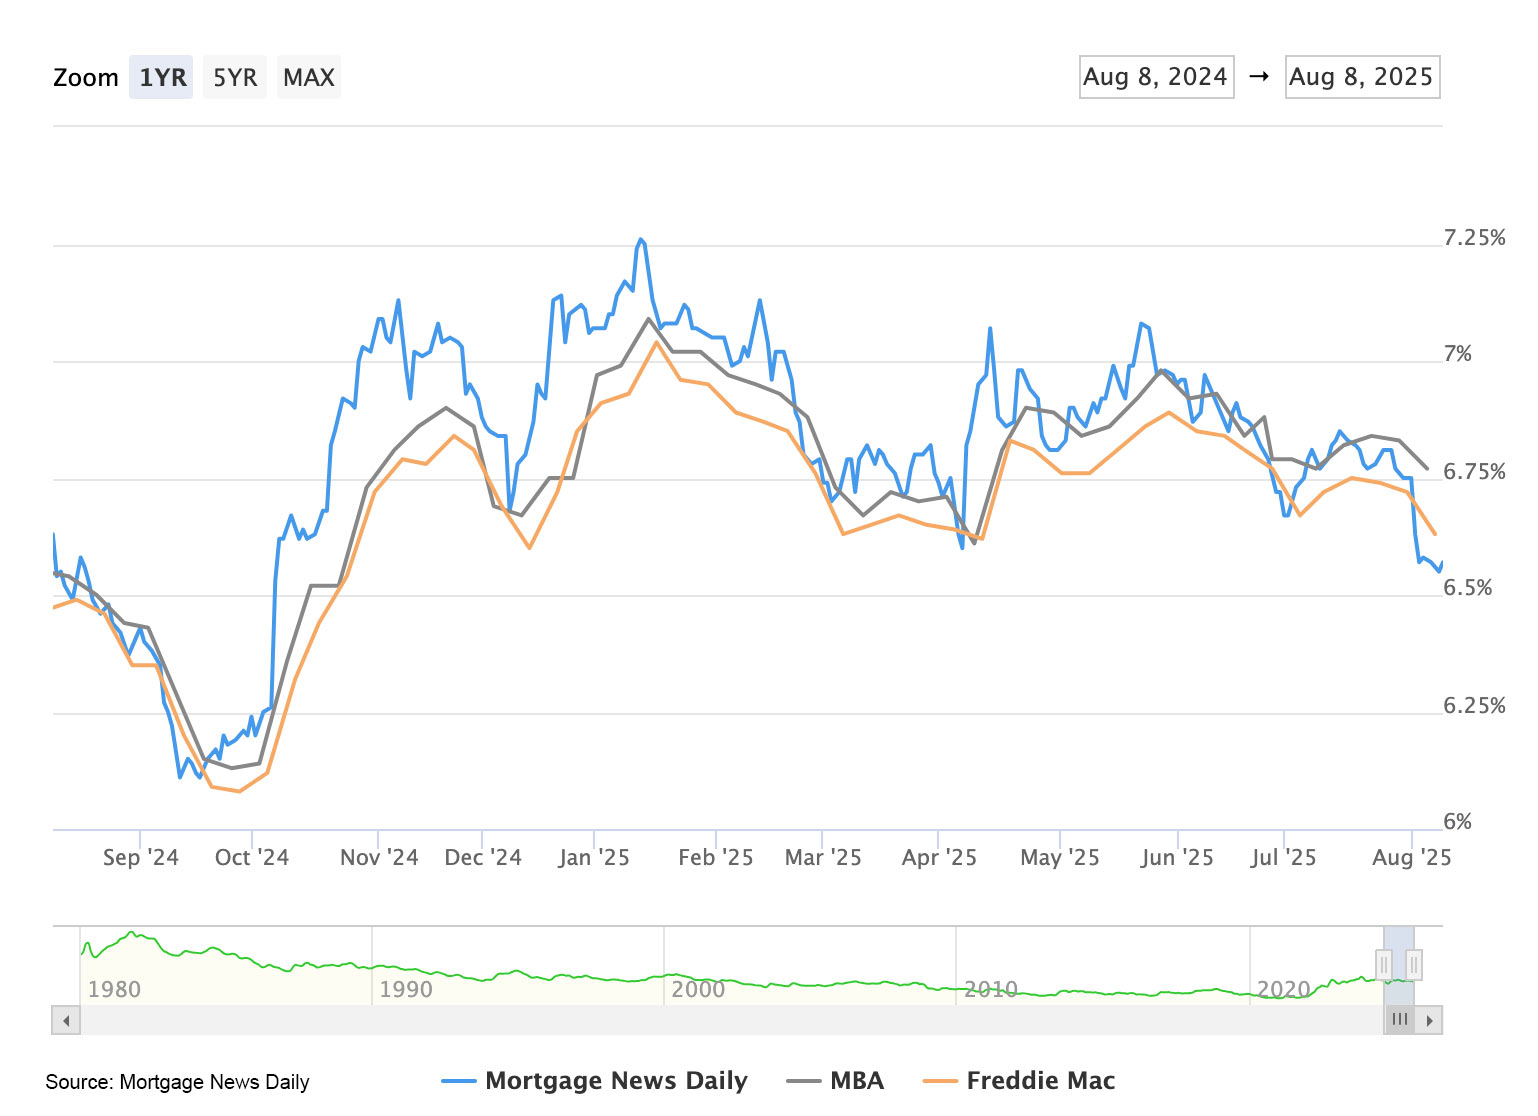
Buyers may be motivated by more inventory choices, better pricing and seller concessions. Plus, lower mortgage interest rates, which have been trending downwards this summer.
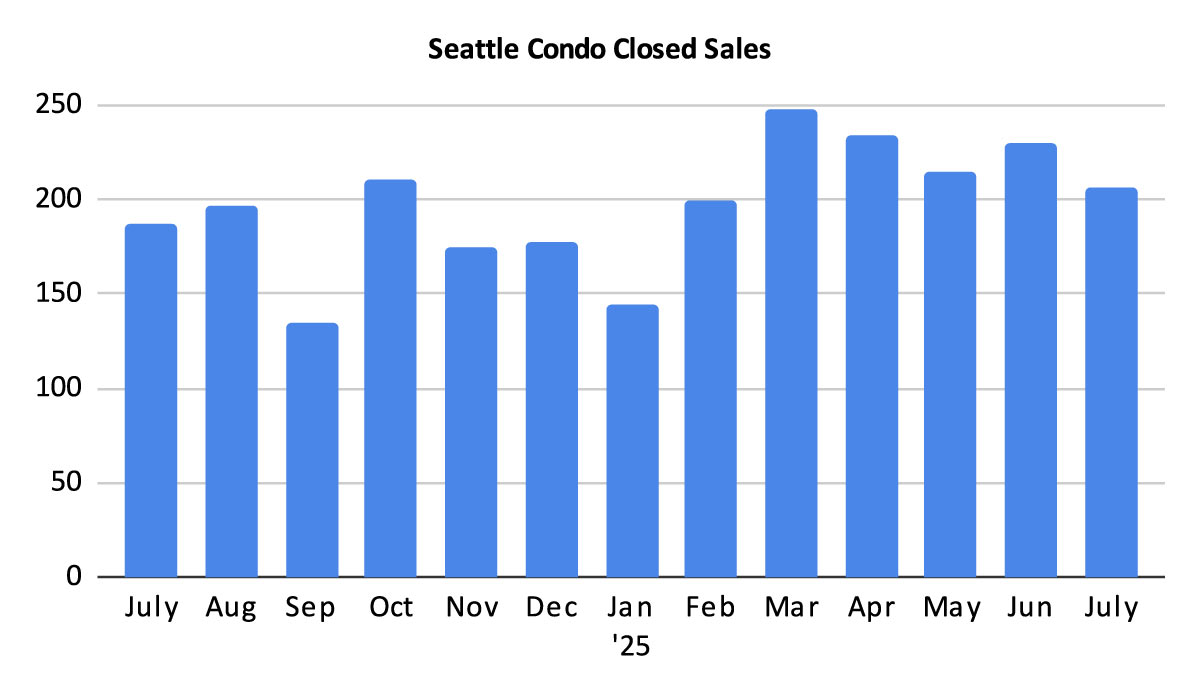
There were 207 closed condo units in July. That represented a 10.7% increase over last July, but also 10% fewer than the prior month. However, that should improve slightly in August given the greater number of pendings in July.
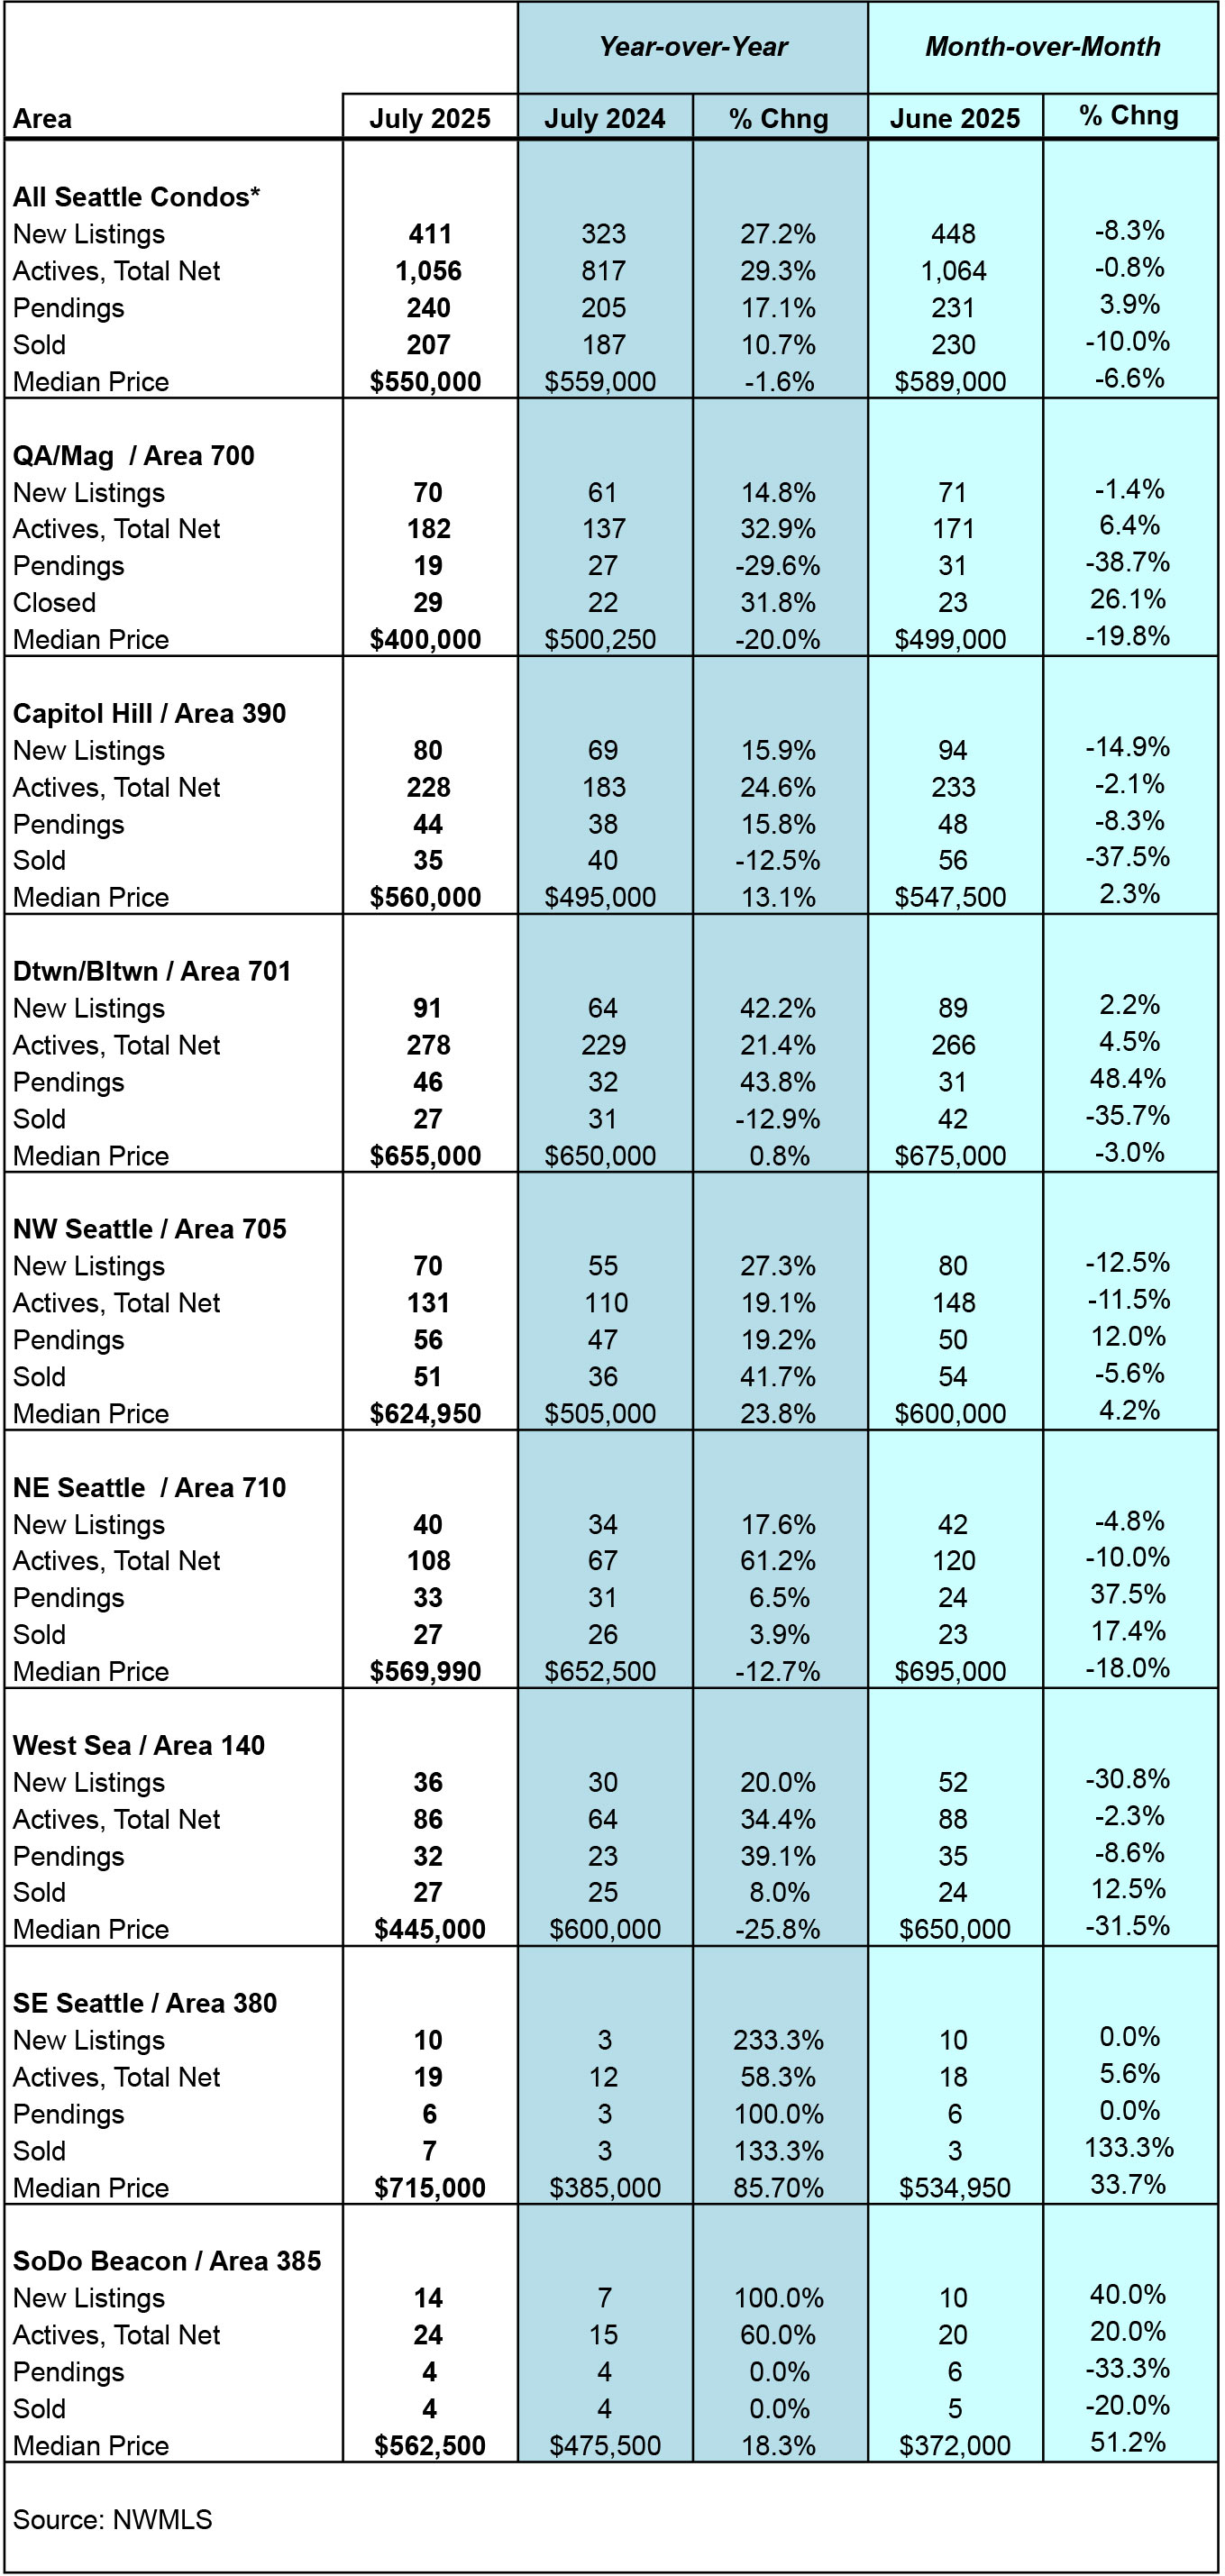
Seattle Condo Market Statistics July 2025
Southeast Seattle exhibited an 85.7% increase in median sales price compared to last July. This is the result of the type of properties sold and a small sample size. In July 2024 all 3 properties were traditional condo units. In July 2025, 6 of the 7 properties were higher-priced new construction townhomes with 1 traditional condo sale.
For Ballard, the percentage of non-traditional condo sales nearly doubled to 41.5% in July. These were newer townhomes and a house boat that raised the median price point upward. They accounted for just 22.2% of the condo sales last July.
For Queen Anne / Magnolia, the quality and type of properties attributed to the 20% decline in median sales price. In July 2024 more luxury condos sold with 22.7% priced over $1,000,000. And, townhomes accounted for 18.2% of the sales. In July 2025, only 1 condo sold for more than $1,000,000 (that’s 0.3% vs 22.7%) and only 2 townhomes (6.9% vs 18.2%). This moved the median point down.
In Summary
Seattle’s condo market ended July with decent results. The number of condo sales were up, as were listings. Though, inventory is starting its cyclical second-half of the year decline. Citywide, the median sales price dipped lower, though it remained positive for most of the neighborhoods.
Stronger sales and current inventory supply levels kept Seattle in a balanced market overall. However, market environments vary based on Seattle’s distinct neighborhood micro-markets. So buyers and sellers will encounter different market dynamics.
Source: Northwest Multiple Listing Service. Some figures were independently compiled by Seattle Condos And Lofts and were not published by the NWMLS.
© SeattleCondosAndLofts.com